Print version of this Book (PDF file)
Viewing the Results
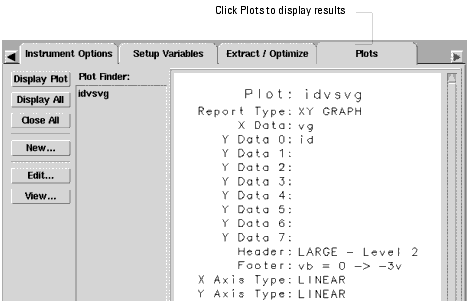
You can view the results of the measured data for a setup by selecting the Plots folder in the Setup window. The Plot Finder list contains all of the plots available for a Setup. If there are multiple plots, select the one you want to view. You can view multiple plots by pressing the Ctrl key while selecting the plot names in the list.
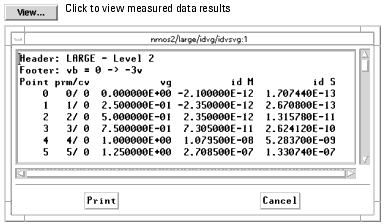
To see the measured data, click View.
You can edit the setup for the data table in one of two ways:
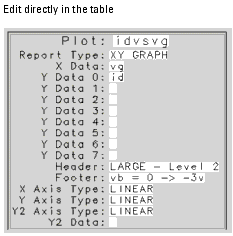
| • | Edit directly in the table. Click or double-click a field and type the new data |
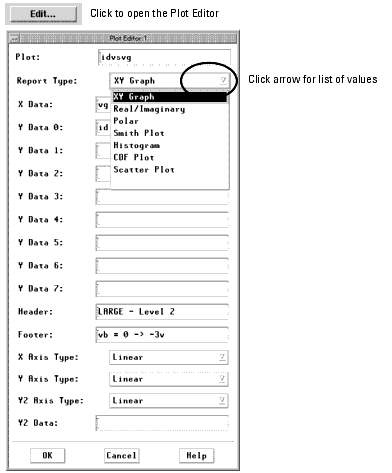
| • | Use the Plot Editor. To open the Plot Editor, first select the table and then click Edit (or double-click on the table). Edit the fields and click OK. |
For a complete description of the editor fields, refer to Chapter 10, "Printing and Plotting."
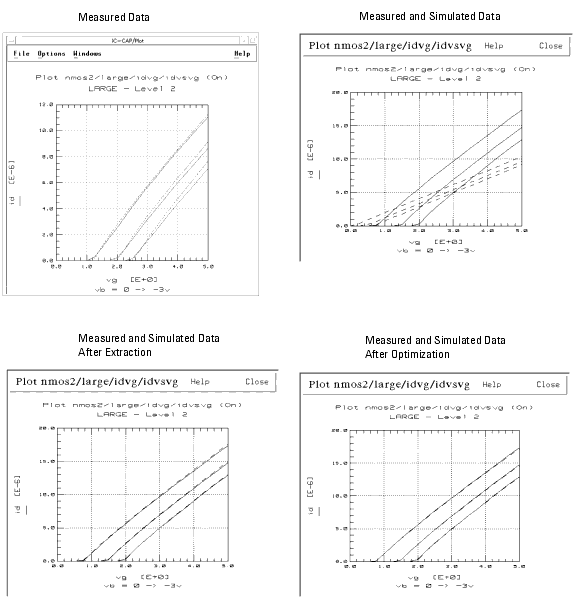
To see the plot, click Display Plot or Display All. ![]() The IC-CAP/Plot window opens. The following figure shows examples of results.
The IC-CAP/Plot window opens. The following figure shows examples of results.
Figure 9 Examples of Displayed Results
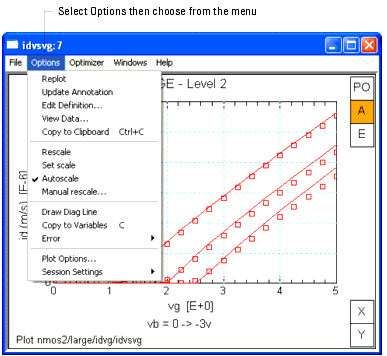
You can define display options by selecting Options in the plot window. For details, refer to Chapter 10, "Printing and Plotting."
