Print version of this Book (PDF file)
Scatter Plot
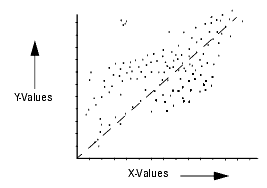
A scatter plot depicts the distribution of pairs of values on a rectangular, two-dimensional plane. It is the most effective method of analyzing the correlation between two variables. Values for one variable are tracked on the x-axis while values for the other variable are tracked on the y-axis.
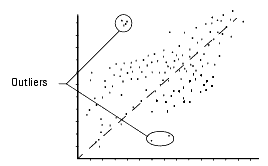
In addition to its ability to depict information about the relationships between variables, a scatter plot is an effective method of discovering outliers, those points that represent unusual, implausible, or impossible values.

