Print version of this Book (PDF file)
Scatter Plot Matrix
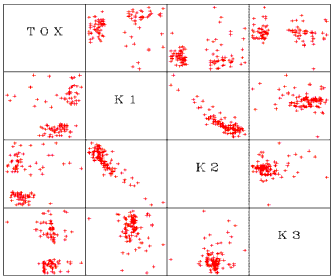
The scatter plot matrix contains multiple scatter plots, with each parameter plotted against every other parameter. For example, if your data had four parameters, P1, P2, P3, and P4, the matrix would contain 16 cells. First would be P1 against itself (only the label appears), then P1 vs. P2, P1 vs. P3, and then P1 vs. P4. The next row would contain P2 vs. P1, the P2 label, P2 vs. P3, and P2 vs. P4, and so on. If you have a large number of parameters, the plots will be quite small. You may want to deactivate parameter columns to reduce the number of plots of interest, or only select the ones of interest.
