Print version of this Book (PDF file)
Cumulative Density Plot
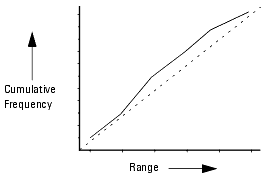
A cumulative density plot depicts either the cumulative frequency or the cumulative relative frequency of data distribution. It is typically used to track variations between contemporaneous observations by highlighting changes in mean levels. In a cumulative density plot the x-axis displays the value ranges while the y-axis plots the cumulative frequency or cumulative relative frequency for each range.
A cumulative density plot offers a comparative visualization of current results within the context of a reference distribution. It is ideal for situations where the rate of specific changes needs to be tracked.
