Print version of this Book (PDF file)
Measure Noise
Start > Measure Noise
The diagram below shows the general setup for noise measurement.
Figure 234 Noise Measurement Test Setup
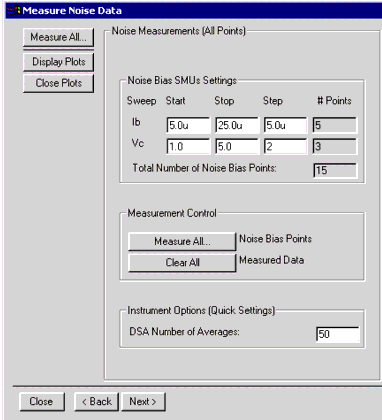
Clicking on Measure Noise on the Start Wizard window launches the Measure Noise Data window shown below.
This half of the dialog box is captioned Noise Measurements (All Points). It is used to make automatic measurements of a number of DC bias points. This number is determined by the product of the number of Ib points swept and the number of Vc points swept. This is typically 10 to 20—in this example 15. Within this box is the Noise Bias SMU Settings box. You use this to set the start and stop values of Ib and Vc, and the step sizes. From this data, the number of points in each range is calculated and displayed, and also the total number of Noise Bias Points.
Figure 235 The Measure Noise Data Window - LEFT HALF
The Noise Points MUST be a subset of the points measured in the Verify DC setup.
Note
In the Measurement Control box the Measure All button is used to start the automatic measurement.
The Clear All button is simply a convenience in starting a new measurement setup.
The Instrument Options box contains only the DSA Number of Averages value. This is typically between 50 and 100.
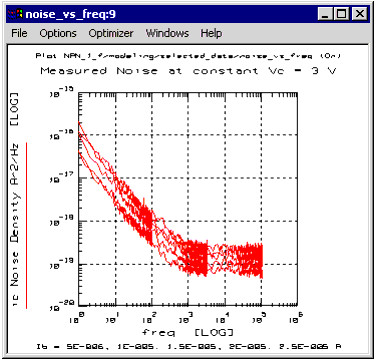
The button titled Display Plot only displays noise measurements at constant Vc.
Individual Noise Measurements at constant Vc
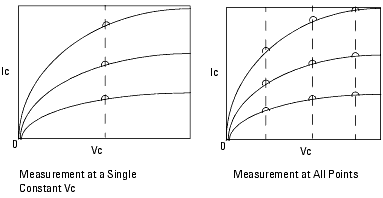
The box captioned Noise Measurements at constant Vc is used to make noise measurements at constant Vc only. The bias conditions are chosen from the set defined in the All Points window to the left.
Use the Choose Vc dropdown list to select the value.
When selecting a Vc value, the previously measured noise points at other Vc values are skipped during this measurement, and the past measurement data are left unchanged in the repository.
Note
Figure 236 Measurement of Ic at a Single Constant Vc versus at All Points
Figure 237 The Measure Noise Data Window - RIGHT HALF
Use the Measure button to start the measurement. It will launch a window titled Measure Single Noise Point Setup shown in the next figure.
This dialog gives you guidance and a checklist for completing the single point measurement. The top box titled Now Measuring gives the bias point sequence number, and the Vc an Ib bias conditions. The next four boxes let you check and launch the measurement.
- Step 1 Set the output bias voltage on the Low Noise Amplifier (LNA). In the Stanford Research LNA this has to be done manually. In the front panel, look under the area "Bias Voltage". The output voltage is switched on using the "ON" button. The other buttons are used to set the voltage. The user should use a voltage multimeter to check the collector voltage by probing the contact labeled TEST. Check the check step 1 box when the LNA is set.
Before proceeding to the next step, make sure that the input filter has had enough time to be fully charged so that the device is biased at the chosen operating point.
Note
- Step 2 Set the current offset in the LNA. The suggested value is the value measured during the DC trace measurements for that bias point. For the Stanford Research LNA, this has to be done manually. Refer to the area labeled "Input Offset" in the LNA front panel. When set, check the check step 2 box. Choose a value as near as possible to the DC device output current.
- Step 3 Set the sensitivity of the LNA. Refer to the area labeled "Sensitivity" in the LNA front panel. When in Demo mode, the suggested value of 4e-6 Amps/Volt is automatically generated and it is based on the device output conductance. In order to obtain the best performance out of the LNA, the sensitivity of the LNA should be set equal to the device output conductance. However, keep in mind the following considerations:
- Step 3 Set the sensitivity of the LNA. Refer to the area labeled "Sensitivity" in the LNA front panel. When in Demo mode, the suggested value of 4e-6 Amps/Volt is automatically generated and it is based on the device output conductance. In order to obtain the best performance out of the LNA, the sensitivity of the LNA should be set equal to the device output conductance. However, keep in mind the following considerations:
| • | The output conductance is calculated using a derivative function and therefore may be rather noisy and give non-meaningful values for the sensitivity. |
| • | If the gain is too high, the amplifier output will saturate. |
- The operator should choose the minimum sensitivity which does not saturate the amplifier output. The operator has to set the actual value in the instrument (in this example: 200e-6 Amps/Volt) and then enter it manually into the box labeled Type Actual Value. When set, click the check step 3 box.
- Step 4 Measure noise at this bias point. Click on the button labeled OK, Measure to start the noise measurement at this point. After the noise measurement, the Single Point setup will take you automatically to the next point in the sequence.
- Instead of measuring the noise at this bias point you can click on Next Point. When skipping the point, the noise data in the repository are retrieved. Exit will skip all the remaining points, and end the measurement procedure.
- At the end of each Noise point measurement the following dialog pops up:
- Step 4 Measure noise at this bias point. Click on the button labeled OK, Measure to start the noise measurement at this point. After the noise measurement, the Single Point setup will take you automatically to the next point in the sequence.
- By clicking OK, the operator accepts the measurement data at this bias point and proceeds to the next point in the sequence. Clicking Repeat Measurements will display the Single Point measurement dialog to repeat the measurements. The user might vary the LNA settings, the number of averages and repeat the measurement.
| • | Measure All: Measures all noise points (Same as Measure All in the Noise Measurement All Points area. |
| • | Display Plots: Displays noise at the selected Vc and the noise of the last point measured. |
| • | Close Plots: Closes all plots. |
Start > Extract > Select Vc
Clicking on Extract in the Start Wizard window launches the Extract Noise Parameters window shown below. The DC Bias Overview shows the DC setting used for the noise measurement. The user is not allowed to change this table since the noise bias point were set before the Noise Measurements and the noise have been measured already.
Click on the Select Vc tab. Select the Vc value at which you want to perform the extraction. A noise data plot at the selected Vc will be displayed automatically, as shown below.
Extraction of noise parameters Af and Kf
Start > Extract > Select Frequency
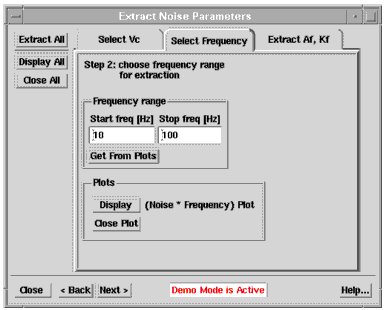
- Click on the Select Frequency tab. A Noise · Frequency versus Frequency plot will be displayed automatically, as shown below. On the plot select the area where you would like to extract the noise parameters with a box, then press Get from Plots. Alternatively, type the frequency range directly in the Start freq and Stop freq boxes.
Choose a frequency range where the traces are flat, i.e show an ideal 1/f behavior.
Note
- Start > Extract > Extract Af, Kf
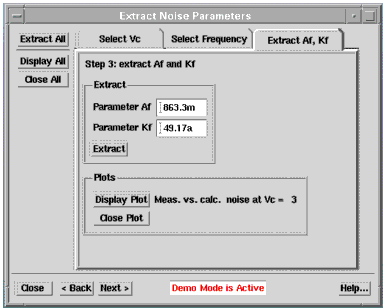
- Click on the Extract Af, Kf tab. Select Extract to extract Af and Kf in the selected frequency range. The plot of measured and calculated noise versus frequency, shown below, will appear and the parameters Af and Kf will be extracted.
- Click on the Extract Af, Kf tab. Select Extract to extract Af and Kf in the selected frequency range. The plot of measured and calculated noise versus frequency, shown below, will appear and the parameters Af and Kf will be extracted.
The calculated noise sample uses equation (1) for bipolar or (3) for MOS. The calculated noise is only valid in the 1/f noise region.
Note
Buttons on Left Side of Dialog Box
| • | Extract All: automatically extracts Af and Kf using the previously specified Vc and frequency range. Automatically opens all plots and ends in the last tab displaying the extracted Af and Kf. |
| • | Display All: Displays all plots. |
| • | Close All: Closes all plots. |
Start > Simulate
Clicking on SImulate in the Start Wizard window launches the Simulate Noise window shown below.
Figure 238 The Simulate Noise Window - LEFT HALF
The simulation dialog has three main areas:
| • | Simulation settings. Select or change the simulator. Select the collector voltage Vc. Selecting Vc will retrieve the Noise Data from the dataset and display them. |
| • | Tune Noise parameters. Tune parameters Af and Kf. |
| • | Plots. Use plot annotation to add relevant information to simulated Vs measured noise data plot. Press Update Plots Annotation to update plot with the text. |
Figure 239 The Simulate Noise Window - RIGHT HALF
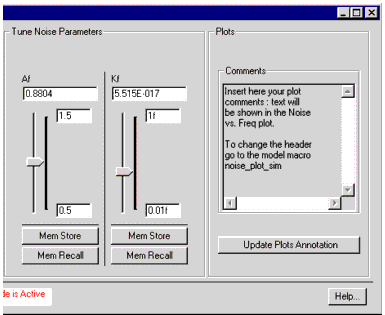
The Tune Noise Parameters box
In order to simulate noise values it is necessary to have values of Af and Kf that are a good fit over the measured range of data. This is done by setting their maximum and minimum values - in this example 2.0 and 0.5 for Af, and 1f and 0.01f for Kf. The actual values used are controlled by the slider. In the noise_vs_frequency plot, shown below, the yellow simulated (calculated) curves yellow respond to the slider-selected value of Af, and match the red (measured) data curves best with Af at 979.4m. This "eye-balling" method of curve-fitting works quickly and well.
The simulation is performed using the selected Vc, change Vc and re-simulate to see how the extracted parameters fit the other Vc values.
Note
Buttons on the Left Side of the Dialog:
- Simulate: runs simulation in setup verify/simulate.
- Clear: clears simulated data.
- Display Plots: displays measured vs simulated noise data at constant Vc.
- Close Plots: closes noise plot.
- Clear: clears simulated data.
Start > Data Manager
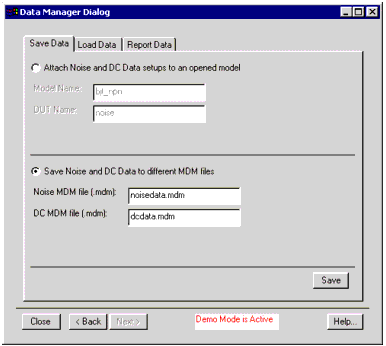
Clicking on Data Manager in the Start Wizard window launches the Data Manager Dialog window shown below.
The Data Manager Dialog has three tabbed folders, titled:
| • | Save Data |
| • | Load Data |
| • | Report Data Start > Data Manager > Save Data |
The dialog presents two choices:
- Attach Noise and DC Data setups to an opened model
- or
- Save Noise and DC Data to different MDM files.
- or
Selecting Attach Noise and DC Data setups... allows you to save the noise and DC measurement data to a model. The model must be opened with its icon in the IC-CAP main window. This option may be useful when you want to keep all the measurement data (electrical, noise, etc.) in the same model file.
Selecting Save Noise and DC Data to different MDM files Noise and DC data are saved in the specified MDM files.
Important Note: Along with the DC and Noise Data, IC-CAP also saves to a DUT or the MDM files some key setting variables and the extracted noise parameters. IC-CAP saves the following variables:
| • | the DC sweeps variables (inDC_IB_START, inDC_IB_STOP, inDC_IB_STEP, inDC_VCE_START, etc.) and the extracted BF. |
| • | the noise sweep variables (inNOISE_IB_START, inNOISE_IB_STOP, etc.). |
| • | the extracted noise parameters Af, Kf (Ef for CMOS). |
| • | the sensitivity settings of the LNA (Sensitivity). This is essential to display the noise when reading the files back. |
Start > Data Manager > Load Data
Click on the Load Data folder.
Select Read Noise and DC Data from an opened model to read noise and DC measurement data from a model. The model must be opened and located in the IC-CAP main window. Selecting Read reads DC and Noise measurement data from the DUT to the repository's setups.
Bias settings for DC and Noise measurements will be changed according to the settings stored in the DUT. Actual DC and Noise bias settings, extracted values, and LNA sensitivity settings will be lost and replaced by the values saved in the DUT.
Caution
Select Read Noise and DC Data from MDM files to save Noise and DC data to the specified MDM files.
Bias settings for DC and Noise measurements will be changed according to the settings in the MDM files. Actual DC and Noise bias settings, extracted values and LNA sensitivity settings will be lost and replaced by the values saved in the MDM files.
Caution
Start > Data Manager > Report Data
Report Data tab folder.
Select Generate Report to write a text report to the specified file name. To change the report format see transform Gui Driver/Data Manager/Generate Text.

