Verify DC
Start > Verify DC
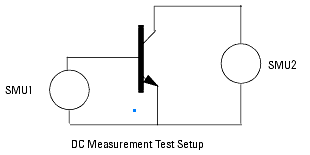
Clicking on Verify DC in the Start Wizard window launches the Measure and Simulate DC Data window, shown below in two parts. The objective of this measurement is to verify the transistor I-V curves, and (for bipolar) tune the DC current gain,  , and calculate the output conductance g0. , and calculate the output conductance g0.
This window guides you through the DC measurements and simulation of the Ic-Vce characteristics.

Buttons on the Left Side of the Dialog:
| |
• |
Run All: Run measurement and simulation automatically. |
| |
• |
Measure: Run measurement in the setup DC_sweep. |
| |
• |
Simulate: Run simulation in the setup DC_Sweep. |
| |
• |
Display All: Display all the DC plots. |
| |
• |
Close All: Close all the DC plots. |
The DC working area consists of three parts:
| |
• |
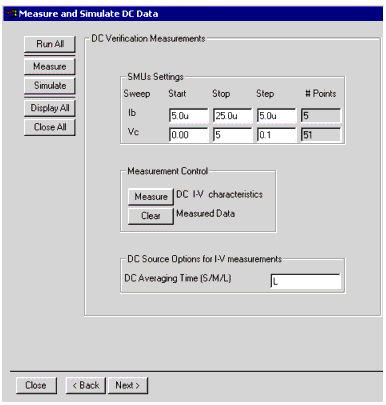
DC Verification Measurements Set the DC bias source (start, stop number of points) for input and outputs. Set integration time. Run the measurement or clear the measurement data. |
| |
• |
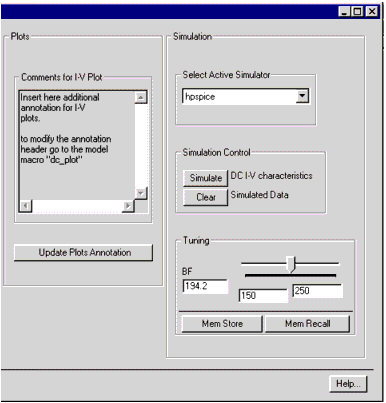
Plots A text comment region lets you write text which will be reported in the output characteristics plot. Use Update Plot Annotation to update plot comments.The annotation macro is defined under Macros and is called dc_plot. Annotation will be printed with the plot. Also, any annotation text will be printed on the final report. |
| |
• |
Simulation Select the simulator. Use the Simulate button to run the simulation. The Tuning table allows you to fine tuning the device current gain  . This is extremely important since the device . This is extremely important since the device  will be used later in the final tuning of the extracted parameters obtained by comparing measured and simulated noise. will be used later in the final tuning of the extracted parameters obtained by comparing measured and simulated noise. |
|
Caution
|
|
|
|
|
Changing the simulator will load new Circuit, Subcircuit, and Parameter files (if those are found). Previous Circuit/Subcircuit and extracted parameters will be lost.
|
|
Figure 232 The Measure and Simulate DC Data Window - LEFT HALF
|

|
The left side of the dialog box is captioned DC Verification Measurements. It is used to make automatic measurements of a number of points. This number is determined by the product of the number of Ib points swept and the number of Vc points swept. The DC Averaging Time option changes the DC Analyzer integration time without re-opening the Settings dialog. An internal transform checks start, stop, and step input values. When errors are found, the input field turns red, and a warning is written to the IC-CAP status window. The transform also checks whether the total number of DC points for DC I-V measurements is greater than the maximum number allowed (see Settings).
Figure 233 The Measure and Simulate DC Data Window - RIGHT HALF
|

|
|
Caution
|
|
|
|
|
Changing the simulator at this point forces a reload of the circuit, subcircuit, and parameter decks. Any previous changes will be lost unless they are saved first.
|
|
Tuning Beta
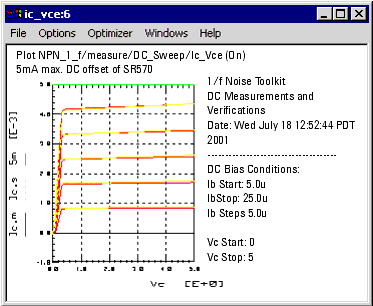
In order to simulate noise values you need a value of beta that is a good fit over the measured range of data. This is done by setting the maximum and minimum values of beta - in this example 150 and 250 respectively (see previous figure.). The actual value used is controlled by the slider. In the Ic versus Vc plot (titled ic_vce), the yellow simulated (calculated) curves yellow match the red measured data curves best with beta (BF) at 150. See Figure below.
The Mem Store and Mem Recall buttons in the Tuning box allow you to store and recall the "tuned" values of beta for the subsequent noise measurements.

|
 , and calculate the output conductance g0.
 . This is extremely important since the device
  will be used later in the final tuning of the extracted parameters obtained by comparing measured and simulated noise.


