Print version of this Book (PDF file)
Agilent-HBT Model Extraction
The following sections describe the general extraction methods of the Agilent-HBT model adopted in the toolkit.
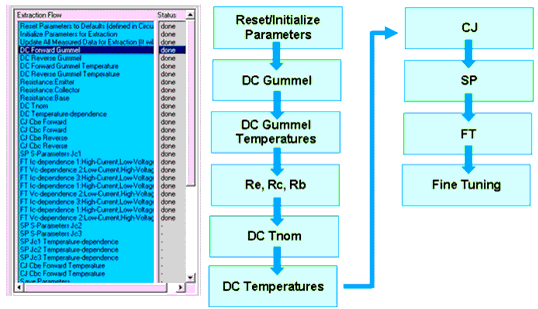
Extraction Overview
Figure 207 Extraction Flow Chart
DC Extraction
DC Forward Gummel Plot
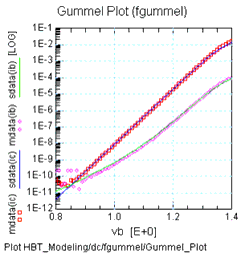
The forward DC Gummel data is initially used to extract and optimize the forward saturation currents (IS, ISH, ISE) and forward ideality factors (NF, NH, NE). A typical forward Gummel plot consists of the collector current Ic and base current Ib.
Figure 208 Forward Gummel Plot
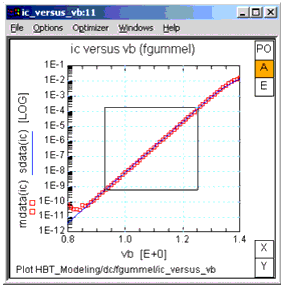
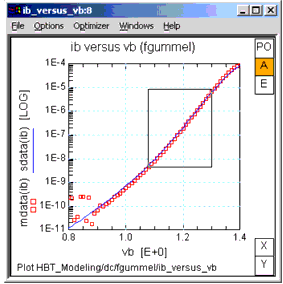
It is important to select the range of biases carefully to extract the saturation currents and ideality factors. The bias range should typically be in a region where self-heating is negligible (i.e., low current densities) since the device junction temperature in the diode equation should not vary significantly within the selected bias region. The selected region should roughly be a straight line on a log10-linear scale. The following graphs provide an example of where to select the bias ranges.
Figure 209 Example of ranging Ic versus Vb for IS and NF extraction and optimization
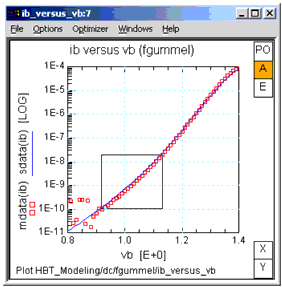
Figure 210 Example of ranging Ib versus Vb for ISE and NE extraction and optimization
In this example, the measurement noise for low Ib should be avoided since the extraction/optimizer will try to extract/optimize this measurement artifact if it is included in the bias range. In some cases, the base to substrate resistance may be significant that this resistance may dominate Ib in the low current region. In this case ISE and NE should not be extracted or optimized.
Figure 211 Example of ranging Ib versus Vb for ISH and NH extraction and optimization
DC Reverse Gummel Plot
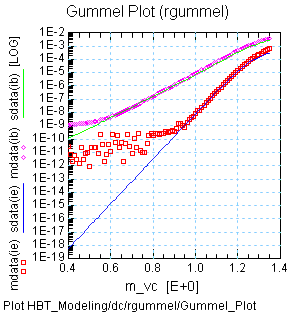
Similar to the forward DC Gummel data, the reverse DC Gummel data is initially used to extract and optimize the reverse saturation currents (ISR, ISRH, ISC) and reverse ideality factors (NR, NRH, NC). A typical reverse Gummel plot consists of the emitter current Ie and base current Ib.
Figure 212 Reverse Gummel Plot
The selection of the bias ranges is very similar to the forward DC Gummel case. Ie versus Vc data is used to extract/optimize ISR and NR. Ib versus Vc data in the low current region is used to extract ISC and NC. Ib versus Vc data in the higher current region is used to extract ISRH and NH. In some cases, ISC and NC may not be extractable due to insufficient data of Ib. In this case, you should not use ISC and NC, but you should extract parameters ISRH and NRH.
DC Gummel Temperature Dependence
The forward and reverse Gummel plots at a different temperature than Tnom (usually at an elevated temperature) is used to optimize the parameters that describe the temperature dependence of the saturation currents in the diode equation. The following list describes how the temperature parameters are related to the Tnom saturation current parameters:
These parameters describe the temperature scaling of the DC saturation currents, and so they should be optimized in a region where self-heating is not significant (i.e., device junction temperature should be constant within the bias region).
DC I-V
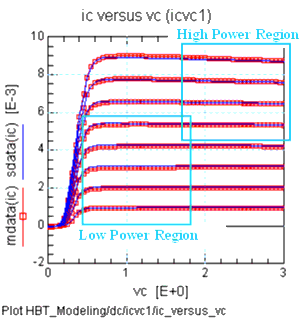
Ic versus Vce plot is used to fine-tune the diode equation parameters in the area of relative low power dissipation (i.e., minimal self-heating).
Figure 213 High/Low Power Region in I-V plane
In the area of higher power dissipation, the thermal resistance (RTH1) is used to fit the self-heating effect. The self-heating effect is described by the combination of the temperature parameters of the saturation currents (e.g., XTIS, XTIH) and the thermal resistance (Note: The bandgap parameters EGE and EGC are also critical, but these are material parameters which should be set before the extraction procedure). Since the temperature parameters of the saturation currents were unambiguously extracted in an earlier step, the thermal resistance should be adjusted to fit the self-heating effect. The thermal resistance can be temperature dependent, and so the parameter XTH1 may also be used to fine-tune the fits.
R Extraction
In general, the device resistances are extracted from network analyzer measurements. Although it is possible to extract an estimate of the device resistances solely from DC measurements, self-heating effects typically cloud the actual values of the device resistance. Since the resistances are usually sensed with significant current through them, it is only natural that the device experiences significant self-heating, which then affects the accuracy of the resistances if extracted from the derivatives of the DC I-V characteristics.
Emitter Resistance
The Real(Z12) method is used to extract the emitter resistance, RE. The real part of Z12 measured at low RF frequencies consists of the constant emitter resistance (RE) and the dynamic junction resistance, which is current dependent. By extrapolating to infinite current (by measuring S-parameters at various collector currents), the constant emitter resistance can be extracted.
Collector Resistance
The total collector resistance is extracted by biasing the collector voltage at Vce=0, sweeping Vbe in forward bias, and calculating from S-parameters measured over frequency. Most of the extracted collector resistance is partitioned to RCX (Extrinsic collector resistance). As a default, 5% of the total collector resistance is allocated to RCI (Intrinsic collector resistance).
Base Resistance
The total base resistance is extracted by biasing the collector voltage at Vce=1V, sweeping Vbe in forward bias, and calculating from S-parameters measured over frequency. The calculation assumes the emitter resistance (RE) is extracted beforehand. This is critical for small area devices where the emitter resistance can be a comparable in magnitude to the base resistance. The default partitioning between RBI (Intrinsic base resistance) and RBX (Extrinsic base resistance) is set at 80/20 where RBI gets 80% of the total base resistance. This partitioning of the base resistance between RBI and RBX is important for accurate high frequency operation (e.g. fmax, MSG, S12, S22, etc), and the fine-tuning of these parameters is done at a later step.
CJ Extraction
Both Cbe and Cbc are extracted using a similar method. Parameters CJx, VJx, and CxMAX (where x="E" or "C") are initially extracted from measured data. Then the forward bias data are used to optimize the aforementioned parameters in addition to MJx. Finally, the reverse bias data are used to optimize the punch-through capacitance parameters VTPx and MJxR.
SP Extraction
Rb Tuning
S11 at high frequencies is used to verify the accuracy of the total base resistance extraction. A tuner can be used to tune RBI and/or RBX to make adjustments to the extracted value. The partitioning of RBI and RBX is not done at this point yet.
Re Tuning
S21 at low frequencies is used to verify the accuracy of the extracted emitter resistance. A tuner can be used to fine-tine RE to make adjustments to the extracted value.
FT Extraction
The total transit time is related to fT by the expression:
By this point of the extraction it is assumed that the parameters associated with resistances Rc and Re and capacitance Cbc are extracted properly. The only parameter that is not extracted precisely is CEMAX (Cbe near forward bias), and so this parameter is optimized in more detail in the transit time parameter extraction. The rest of the fT extraction part will extract and optimize parameters associated with tauB (base transit time), tauC (collector transit time), and tauKE (Kirk effect and/or high current delay).
Ft Region 1 (ftic1)
Major parameters: TFC0, TCMIN, ITC, ITC2
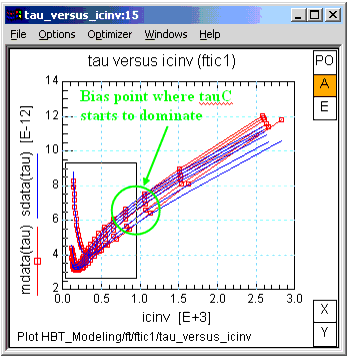
This data is used to extract the initial value of the low current collector transit time parameter TFC0. To extract this parameter, you need to specify the bias region where tauC (in the equation above) starts to dominate by specifying the range like below. Also, initial values of ITC and ITC2 are extracted by examining the fT versus Ic curve for Vcb~0V. TCMIN is optimized to fit the lower current region.
Figure 214 Example of ranging Tau versus inverse of Ic for TFC0 extraction and optimization
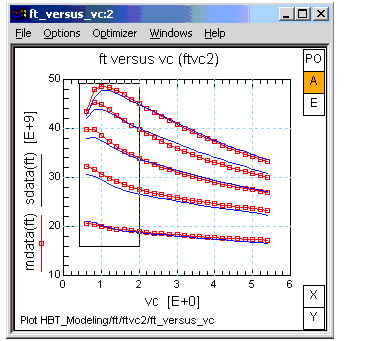
Ft Region 2 (ftvc2)
Major parameters: VTC0INV, VTCMININV
Detailed parameters: VTR0, VMX0, VTRMIN, VMXMIN
These parameters model Vce dependence of fT. It is necessary to select bias ranges carefully to obtain a good fit.
Figure 215 Example of ranging fT versus Vc for VTC0INV and VTCMININV extraction and optimization
Ft Region 3 (ftic3)
Major parameters: TKRK, IKRK, VKRK
Detailed parameters: VKMX, VKTR
These parameters model tauKE (in the equation above) in fT characteristics. Combination of the parameters defines how the effects appear in the fT current-dependence curves.
