Print version of this Book (PDF file)
Sensitivity Analysis Method
The Levenberg-Marquardt optimizer normally prints the sensitivity analysis information every time the Jacobian is calculated. The optimizer options choices Normalize Sens and Print Sens Results control the form and presentation of this information. For more information, see Defining Optimizer Options.
The displayed sensitivities are the normalized RMS partial derivatives of the error vector (difference between measured and simulated data) with respect to each of the parameters being optimized. The RMS partial derivatives are normalized to each other, then all are normalized to 1. For example, suppose two parameters are being optimized, and one has a sensitivity of 0.67 while the other has a sensitivity of 0.33. This means that a change in the first parameter will have approximately twice as much effect on the data as an equal percentage change in the second parameter.
One possible use of sensitivities is in defining an optimization strategy. Successful optimizations require a reasonable balance of sensitivities between the parameters. For example, if four parameters are being optimized and one of the parameters has sensitivity of 0.99, it will be very difficult to determine useful values for the other three parameters. This situation suggests that the dominant parameter must be accurately extracted before optimizing the values of the other three parameters.
Sensitivity Analysis Data
While in sensitivity analysis mode, the partial derivatives at each bias point are stored as transform data, provided that the following conditions are met:
| • | There is only one set of target and simulated data sets. |
| • | There is no bounding of the data in the X or Y dimensions. |
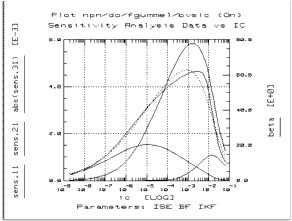
At each bias point an N by 1 matrix, where N is equal to the number of parameters specified in the Param Table, is used to store the data. For example, for a sensitivity analysis transform named sens where there are three parameters, ISE, BF, and IKF, the data is stored as follows:
| • | ISE data is stored in sens.11 |
| • | BF data is stored in sens.21 |
| • | IKF data is stored in sens.31 |
This data can be plotted along with the target and simulated data, as shown in the following figure. This feature is particularly useful for illustrating the interdependencies between parameters and determining the region where each parameter has its largest effect on the simulated data.
