Print version of this Book (PDF file)
Viewing Results
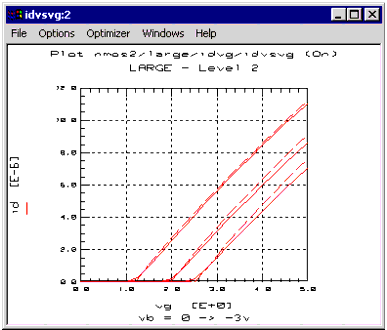
You can view results of both the measured and simulated data in a graphic display. Measured data is represented by solid lines and simulated data is represented by dashed lines. For details on viewing results, see Chapter 10, "Printing and Plotting."
To view the results of the measurement:
| 1 | In the Model window, select DUTs-Setups. |
| 2 | Select the DUT and the setup. |
| 3 | Select Plots. |
| 4 | Click Display Plot or Display All. |
