Print version of this Book (PDF file)
Other Analysis Menu Options
There are several other useful options on the Analysis Menu, including the following:
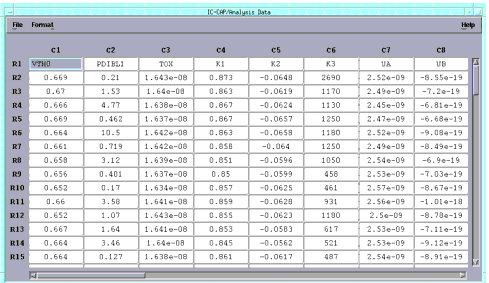
Analysis Data
This feature shows you only the active parameters and samples that are being used for your analyses. For example, if you have deactivated several parameter columns (because they are not of interest at this time) and filtered out a portion of the rows (because they represent bad samples), the Analysis Data window will display only the data that will be used for the current analysis.
To use Analysis Data, choose Analysis > Analysis Data. The Analysis Data window is displayed.
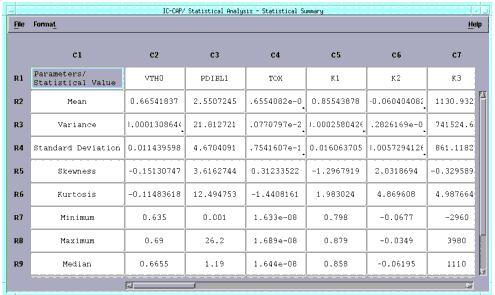
Statistical Summary
The Statistical Summary window shows you standard statistical data, such as mean, variance, standard deviation, skewness, kurtosis, etc. For each parameter, you get a statistical summary that includes all samples that have not been deactivated, filtered out, or deleted.
This feature can be selected from any place in the Statistics program. To select Statistical Summary, choose Analysis > Statistical Summary. The Statistical Summary window is displayed.
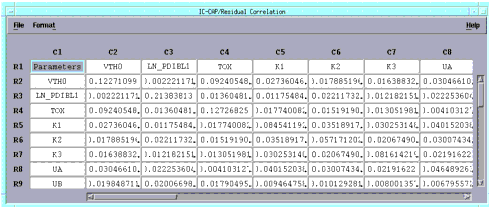
Residual Correlation
For a principal component analysis or factor analysis of less than full rank, the residual correlation shows where the unexplained variance is located.
Residual correlation can be used to see if you have chosen enough factors for your factor analysis, and if not, it can help you spot specific problem areas. You can also use residual correlation to compare principal component analysis to factor analysis by examining their respective errors.
To use Residual Correlation, choose Analysis > Residual Correlation. The Residual Correlation window is displayed.


