|
|
||
05/13/15 |
|
|
Conservation Voltage Reduction: Impact StudyMost of loads are voltage-sensitive, i.e. their power consumption changes as the terminal voltage changes. The act of deliberately reducing the supply voltage in order to reduce the power consumption is referred to as conservation voltage reduction (CVR). In order to quantify the impacts of CVR on each circuit, CVR factor is defined as the ratio of demand reduction percentage over voltage reduction percentage. For example, if a 2% reduction in voltage leads to 1% reduction in the demand, the CVR factor is 0.5. The impact of CVR in a particular feeder over a period of, e.g., one year is one of the important impact studies for CVR. Looking at this from the transmission point of view, it is of interest to understand the impacts on annual energy losses. I conducted a study on BC Hydro's transmission system to understand the impacts of applying CVR to each substation on transmission energy losses. The results showed that having CVR activated in most of the substations yields some reductions in transmission energy losses. However, there are a few substations for which reducing the demand would increase the transmission energy losses. This is particularly due to the nature of power flow. The figure below shows the results of relative energy loss reduction for all the substations. This is defined as the total amount of energy saved at that particular substation divided by the total energy saved in transmission losses due to this particular demand reduction. Another important factor in the effectiveness of CVR is the presence of distributed generation (DG) on the feeder. In some of the BC Hydro's feeders, large DGs (1-10 MW) are connected to the grid. These DGs are mainly run-of-river type with one or more synchronous generator. When DGs are operated in voltage-control mode, they impact the feeder voltage profile and reducing the voltage at the substation does not have the same effects on the demand anymore. Our experience showed that in cases with reverse power flow into the substation, reducing the substation voltage may lead to a reduction in total demand. This depends highly on the generator voltage set-point. If the DG's voltage set-point is close to the substation set-point, reducing substation voltage leads to a reduction in demand since a large amount of reactive power was originally flowing from the substation to the DG location. Other cases have also been studied and are not discussed here.
Impact of demand reduction at substations on transmission annual energy losses. |
||
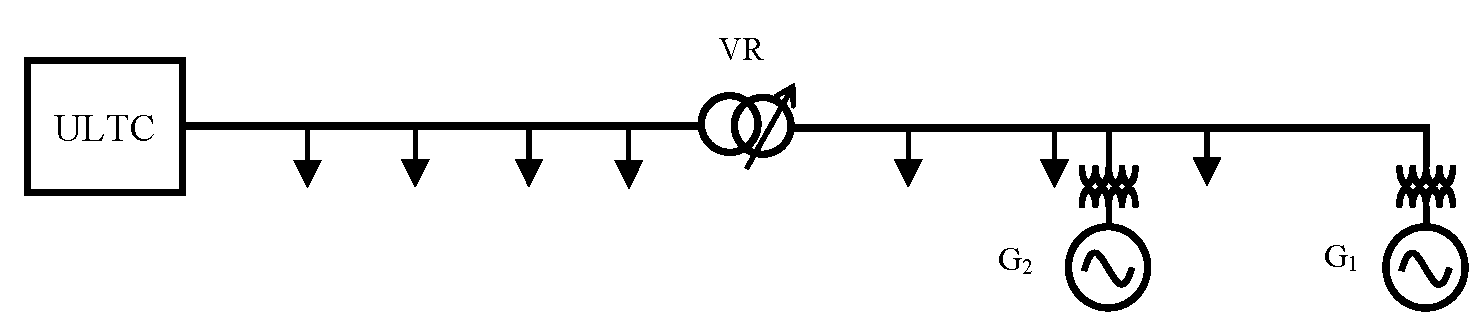
Feeder Voltage Management Issues with Multiple DGs and Voltage RegulatorsApart from their immediate benefits, DGs cause many technical challenges for the distribution system planners and operators. Conventionally, the control and protection schemes in distribution systems were designed based on the uni-directional power flow from the substation to the loads. Installing DGs causes reverse power flows which may cause malfunctioning of protection relays, voltage regulators, switched capacitor banks, etc. Many studies have addressed relevant issues pertained to DG interconnection by either a decentralized approach with no communication or a centralized SCADA-based approach. There are, however, issues that have been neglected. In BC Hydro system, DGs are usually located in remote areas and long LV feeders are the only option for their grid interconnection. Those feeders are usually equipped with voltage regulators (VR) in appropriate locations. If a DG is located downstream a VR, there is a chance of interference in controlling the feeder voltage profile when the DG is operated in voltage control mode. It is merely impossible to find a set-point for VR and DG that insures a harmonized functionality for all the possible operating scenarios of load/generation. Some cases have been observed in BC Hydro system where a DG is absorbing a large amount of reactive power while the VR keeps the voltage at a high level. Absorbing more reactive power to lower the voltage at the DG terminal creates more voltage drop at the VR terminal, causing the VR to tap up and this situation continues unit one of this equipment reaches the upper/lower limits. Another situation that has been observed is when two DGs are connected to the same feeder in different locations. When the DGs are units of the same plant, the reactive power droop is adopted as a good strategy to avoid reactive power circulation. Having DGs in different locations operated in voltage control mode can cause reactive power circulation between them. Choosing the voltage set-points for a particular operating condition does not guarantee its suitability for all the possible scenarios. Considering the dynamic nature of load/generation in distribution systems, a fixed voltage set-point is not an ideal solution. It is recommended to operate DGs downstream of a VR in power factor control mode to avoid the aforementioned issues.
A simple feeder with multiple DGs and a voltage regulator. |
|||
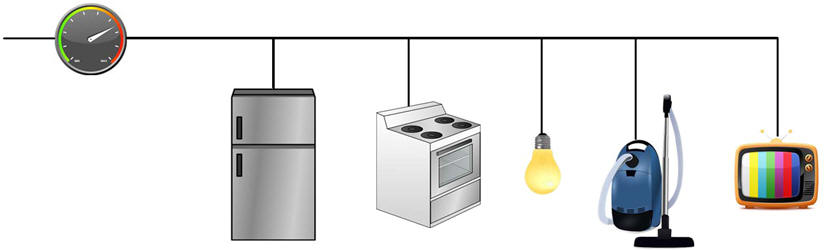
Load Voltage Dependence Model Extraction Using Decomposition TechniquesLoads are voltage-dependent, i.e. changing the terminal voltage leads to a change in the load active and reactive power. It is important to know the load voltage dependence in some of power system studies, such as volt-VAR optimization, power flow, voltage stability analysis, etc. With the deployment of smart metering infrastructure (SMI), a great opportunity emerges in load identification. My vision is to decompose the aggregate measurement at the meter for each customer to understand the load composition: motors, lighting, resistive, electronics, etc. When the load composition is known at every customer site, an aggregate of total load composition for each circuit can be extracted at near-real-time. The load voltage dependence for each load category is known from extensive laboratory measurements. A good estimation of the total load voltage dependence can be built at any level, from LV distribution transformers to MV/HV substations. This data is useful for both distribution (DMS) and transmission (EMS) management systems. Please refer to the following paper for more details: H. Ahmadi, J. R. Martí, "Load decomposition at smart meters level using Eigenloads approach," to appear in IEEE Transactions on Power Systems.
Aggregate load measurement at the meter. |
|||
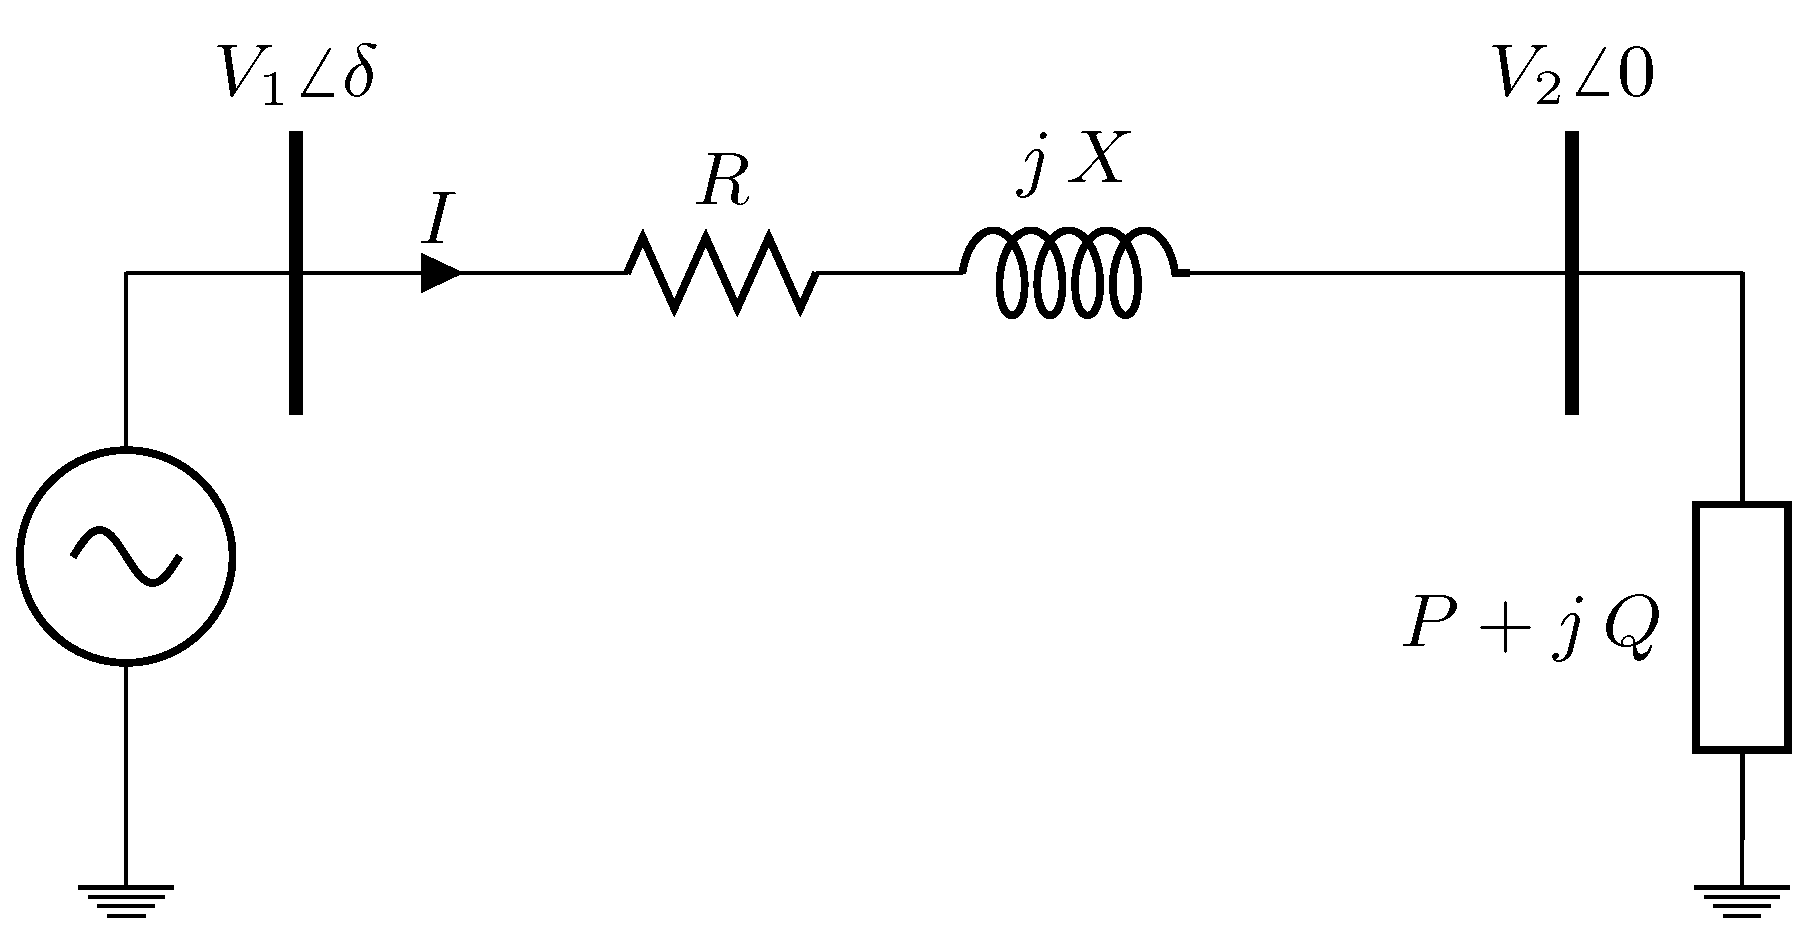
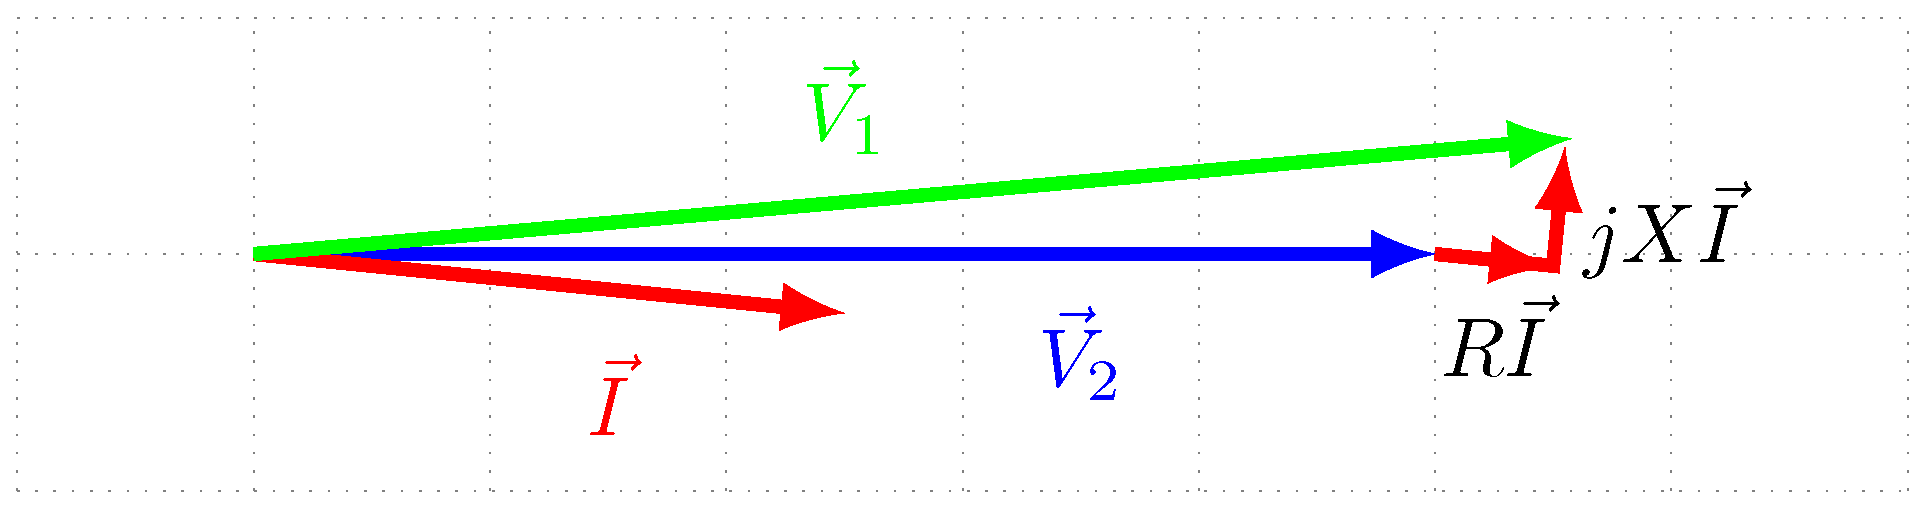
Linear AC Power FlowDistribution systems are different from transmission systems in a number of aspects, including the X/R ratio, the amount of power transferred, voltage levels, etc. Consider a simple model of a feeder shown in the following. Node 1 is the substation, R and X represent the equivalent resistance and reactance between the load and the substation, and a load is connected to Node 2. Choosing some typical values for the parameters, a vector diagram (in per-unit) for the voltages can be drawn, as is done in the next figure (Current magnitude is deliberately enlarged for a clear view). With small current (I) and small line reactance (X), the angle difference between the voltages is quite small. Another important feature of distribution systems is the proximity to the actual loads. Loads are voltage-dependent elements and cannot be modeled using the constant-power load model. Taking into account the voltage dependence of loads and small voltage angles, we reached to the Linear Power Flow (LPF). Power flow equations are the core of many power system analysis tools, such as state estimation, volt-VAR optimization, network reconfiguration, capacitor placement, loss calculation, etc. Traditional power flow solution methods, such as Newton-Raphson and Backward/Forward Sweep, are nonlinear and having them in an optimization problem causes computational issues. As a new paradigm, we proposed the LPF which places negligible error in the solution (see the figure below) while providing tremendous numerical advantages. For more details, please refer to the following papers: J. R. Martí, H. Ahmadi, L. Bashualdo, "Linear power-flow formulation based on a voltage-dependent load model," IEEE Transactions on Power Delivery, vol. 28, no. 3, pp. 1682-1690, July 2013. H. Ahmadi, J. R. Martí, A. Alsubaie, "Sensitivity factors for distribution systems," in Proc. IEEE PES General Meeting, Denver, CO, July 2015.
|
|||
|
A simple distribution feeder. |
Vector diagram for voltage drop in a distribution feeder. |
||
|
Relative error of the voltages obtained by the LPF for a 70-node test feeder. |
|||
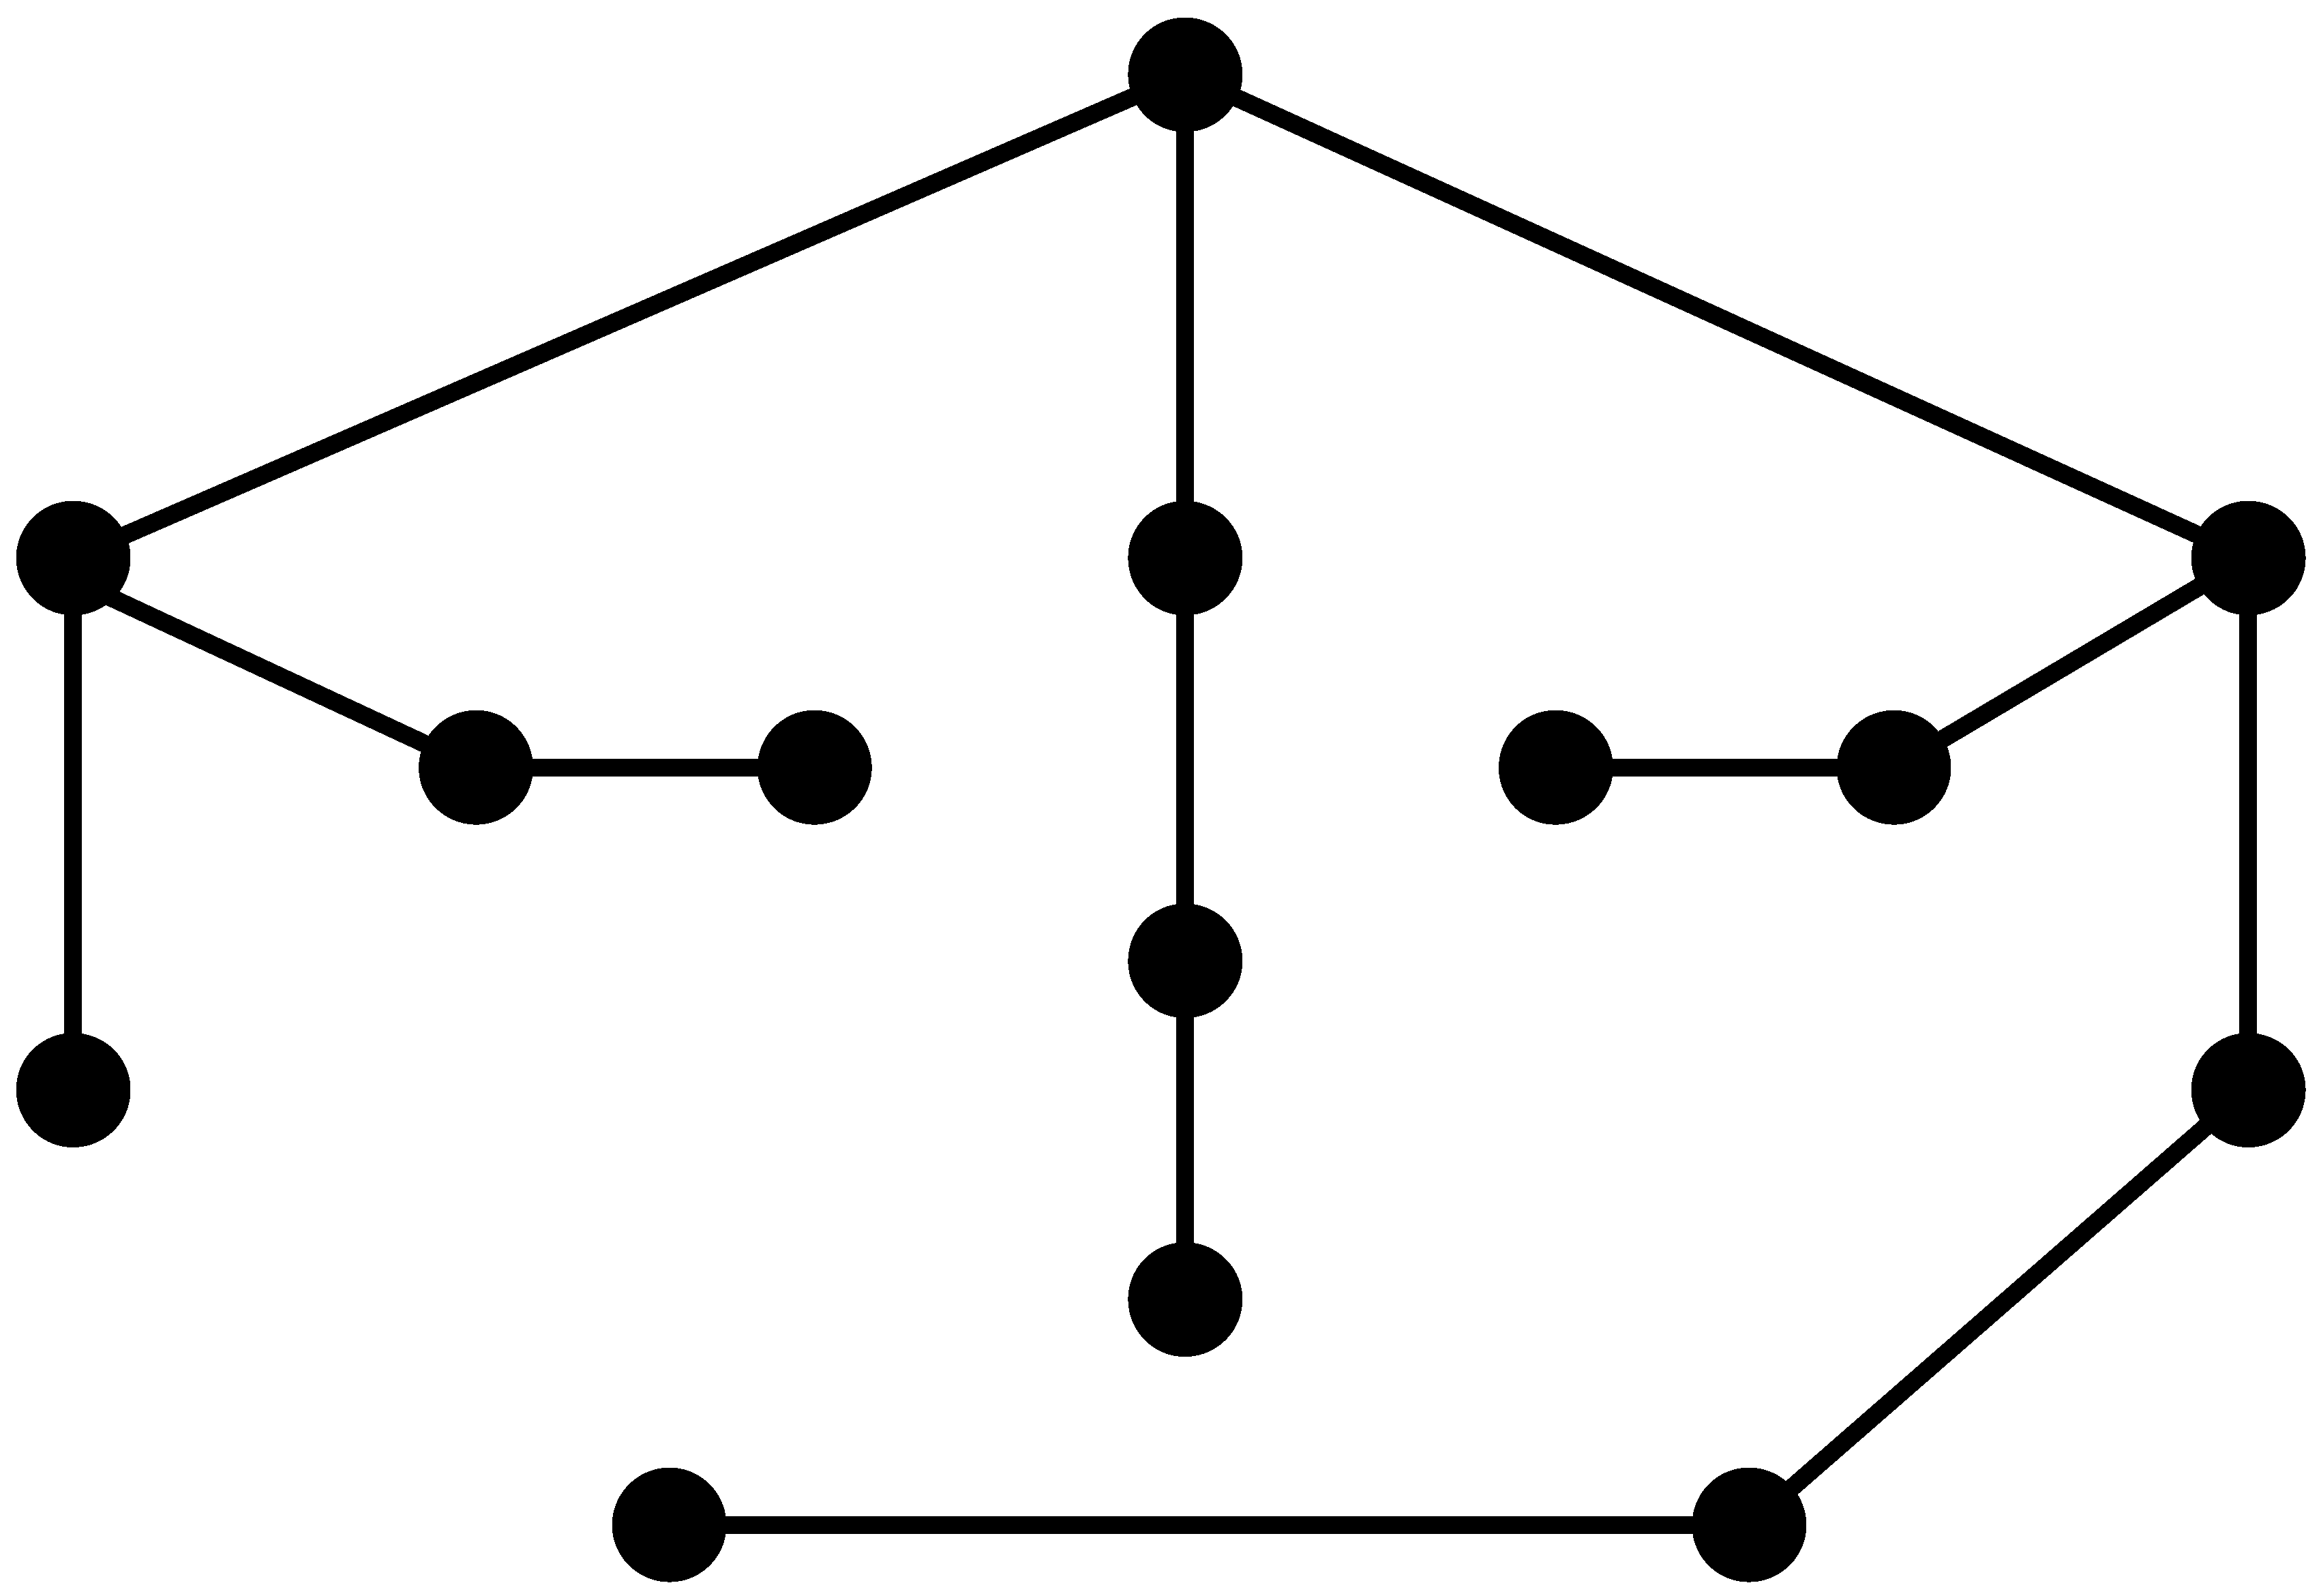
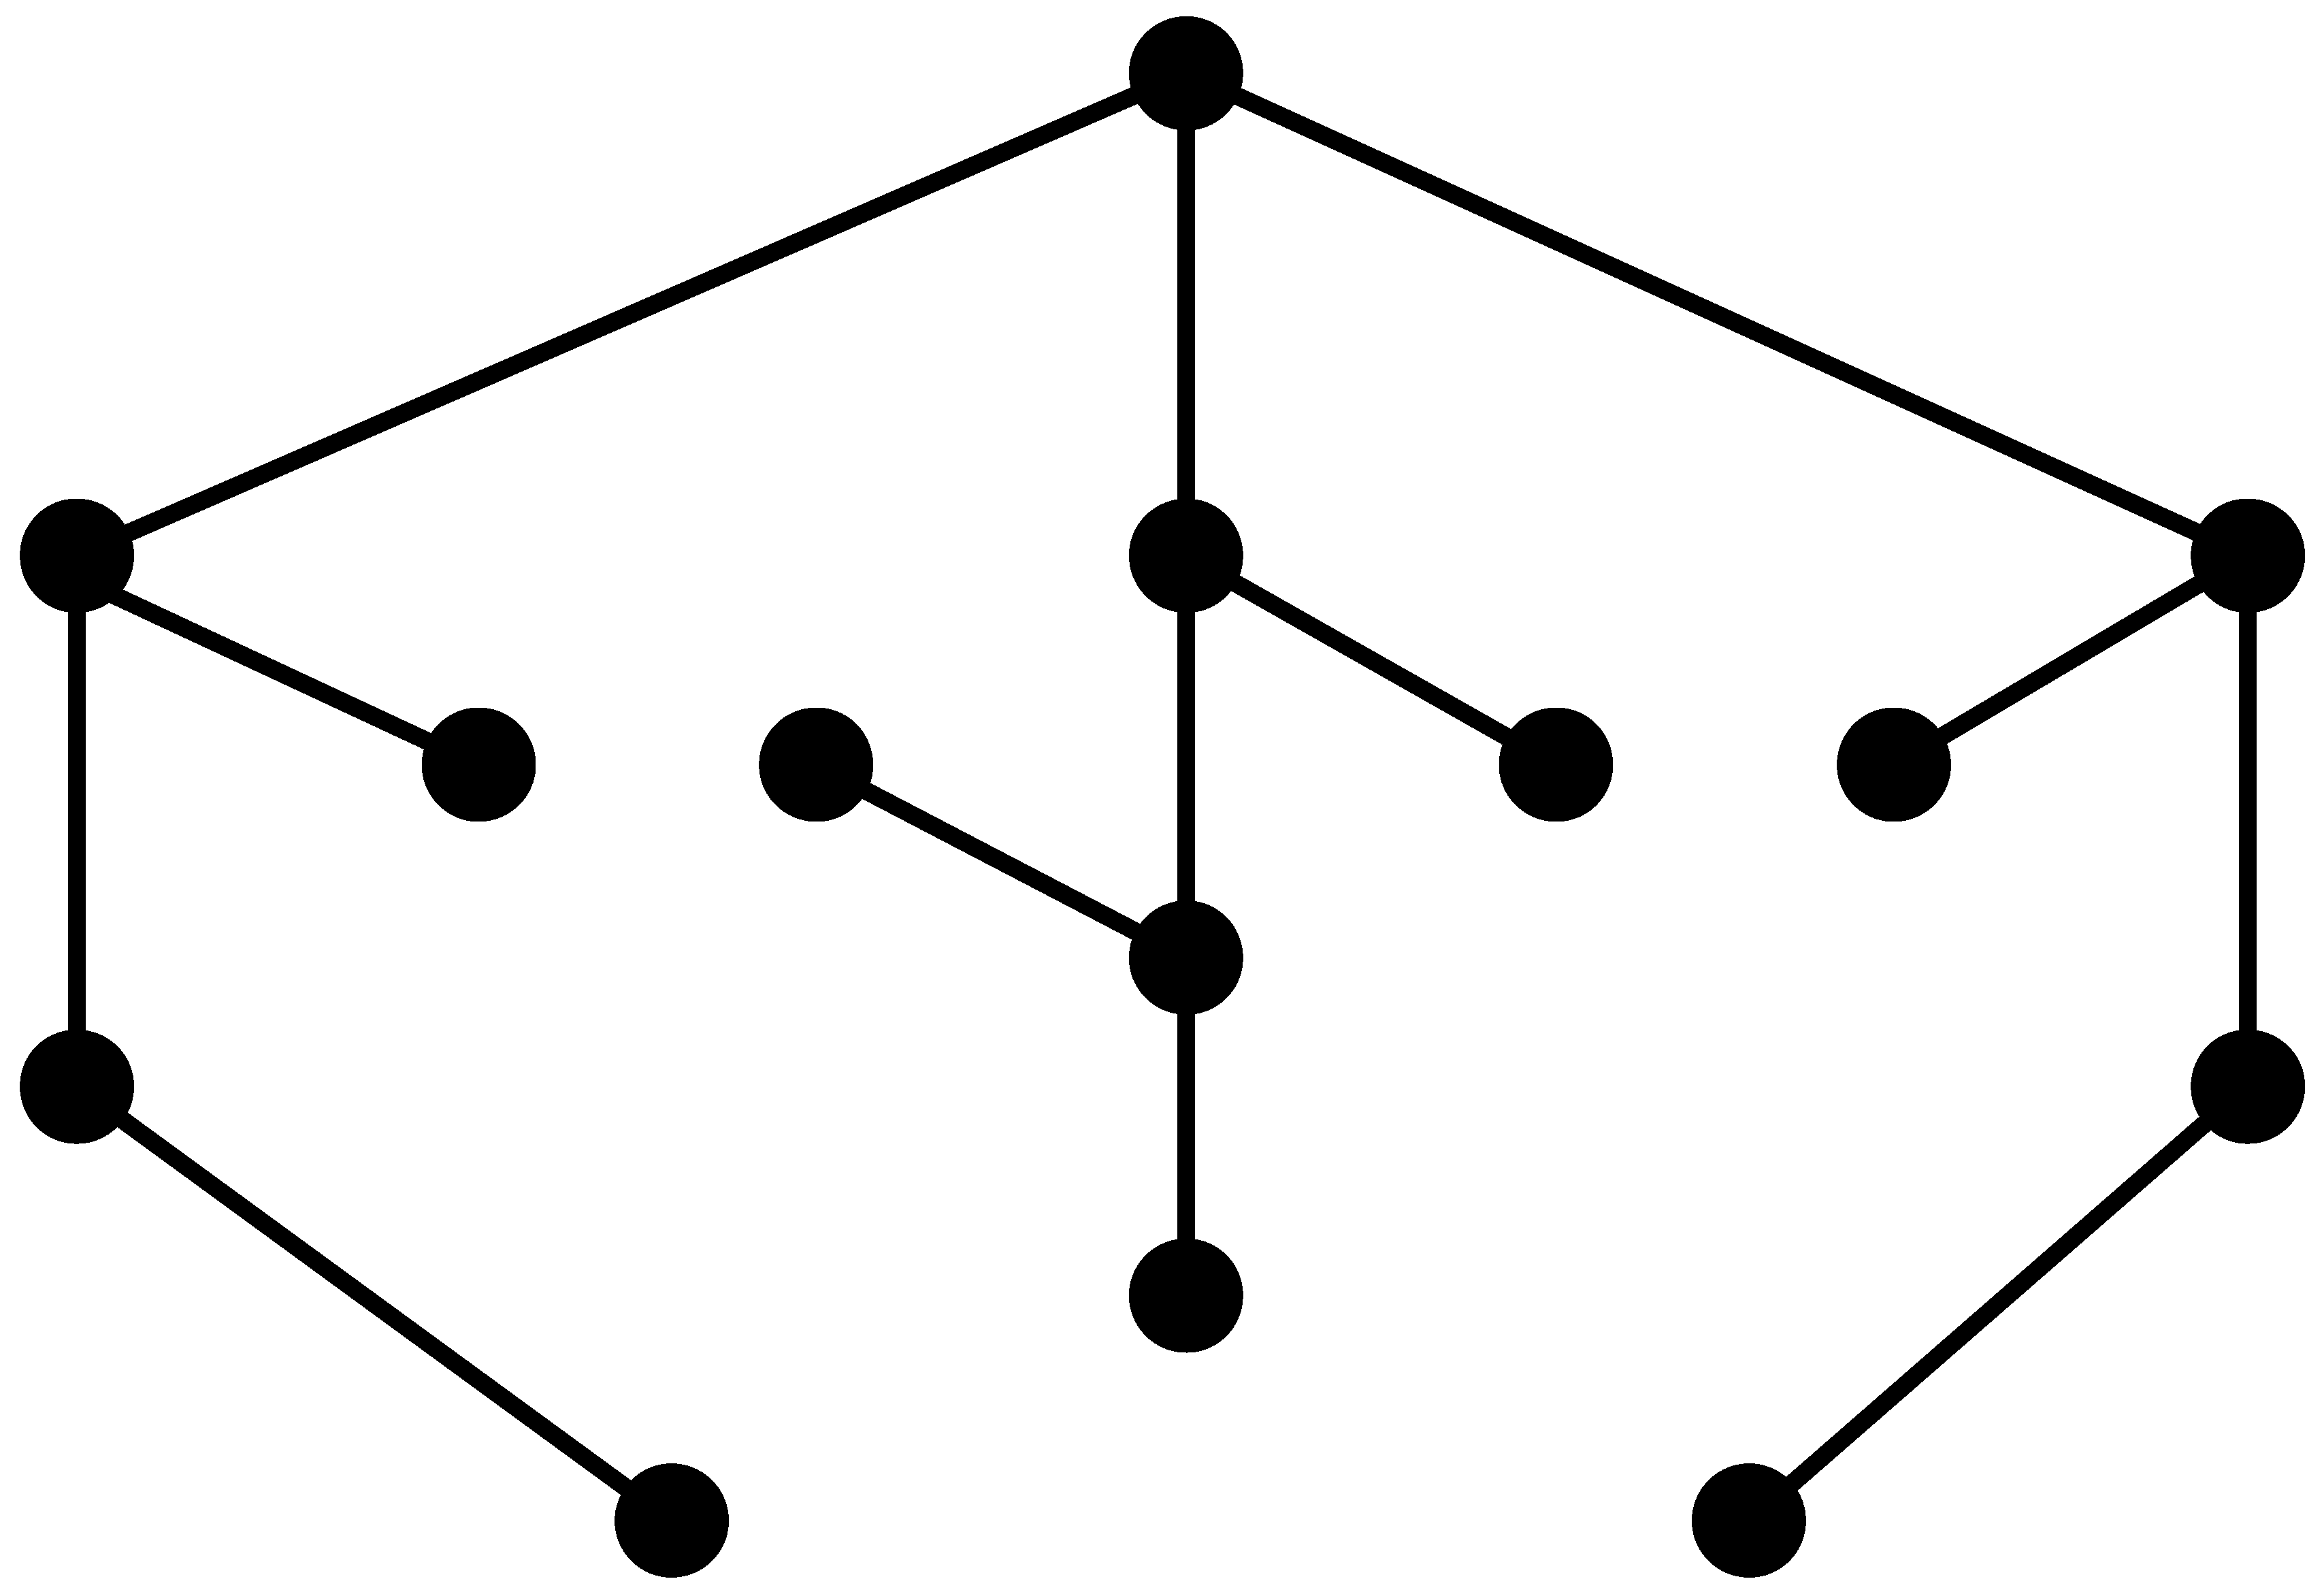
Optimal Network Reconfiguration for Loss Reduction and Load BalancingDistribution feeders are usually built in a radial topology due to its simplicity of operation and protection. There are, however, normally-open tie switches between adjacent feeders. In near future, this switches will be automated in some distribution systems for fast restoration. These switches can be used during non-contingency cases for optimizing the network operation in terms of losses and/or load balancing between feeders. An example is given in the following to show the potential impact of network reconfiguration on power losses. In this simple case, about 30% reduction in total losses was achieved. This problem can be formulated as a combinatorial problem. Using the conventional power flow formulations, the problem turns into a mixed-integer nonlinear programming problem. These types of optimization problems are know of their computational complexity and are not practically tractable. As an alternative, we proposed the application of the LPF in this problem, and with some optimization tricks, the problem can be turned into a mixed-integer quadratically-constrained or even a mixed-integer linear programming problem. These types of combinatorial problems can be tackled using the commercial state-of-the-art solvers to their optimal solution. Apart from the direct optimization approach, heuristic methods can also be applied to obtain a sub-optimal solution in a shorter time. A graph theory-based method was developed which uses the concept of minimum spanning trees. It is possible to find solutions with an optimality gap smaller than 4% for networks with over 10,000 nodes and switches within a fraction of a second. For more details, please refer to the following publications: H. Ahmadi, J. R. Martí, “Linear current flow equations with application to distribution systems reconfiguration,” IEEE Transactions on Power Systems, In Press. H. Ahmadi, J. R. Martí, “Minimum-loss network reconfiguration: a minimum spanning tree problem,” Sustainable Energy, Grids and Networks, vol.1, pp. 1–9, 2015. H. Ahmadi, J. R. Martí, “Mathematical representation of radiality constraint in distribution system reconfiguration problem,” International Journal of Electrical Power & Energy Systems, vol.64, pp. 293–299, 2015. H. Ahmadi, J. R. Martí, “Distribution system optimization based on a linear power flow formulation,” IEEE Transactions on Power Delivery, vol.30, no.1, pp. 25-33, 2015. |
|||
|
Configuration 1: Losses = 620 kW. |
Configuration 2: Losses = 435 kW. |
||
Volt-VAR Optimization (VVO)Distribution systems are sometimes equipped with voltage and/or reactive power (VAR) support devices, such as voltage regulators, switched capacitors, etc. Some of these equipment provide discrete control. Voltage regulators are equipped with multiple taps and can regulate the voltage up to 10% their nominal voltage, in steps of, e.g., 1%. Switched capacitors have some embedded logic that monitors the network voltage/reactive power flow and makes a decision accordingly to switch ON/OFF. Since these devices use mechanical switches, there is a limited number of switching actions that can occur due to mechanical erosion. From an asset management point of view, it is important to only make a switching action if it makes a meaningful impact on the network performance and limit the unnecessary actions. With the SCADA system in place, it is possible to have a centralized control scheme that optimizes the network performance by minimal control actions. In order to do this, a prediction of feeder loads at some aggregate level is needed. The smart metering infrastructure (SMI) can be adopted to make the predictions for a day-ahead planning horizon. The concept is, to some extent, similar to the unit commitment problem in the transmission system, where the status of generators is determined based on the the day-ahead load forecast to minimize the generation and operation costs. Once the day-ahead plan is formed, flexibilities are introduced during the real-time operation to compensate for the possible mismatch between the forecast and actual load. If available, continuous sources of volt-VAR support, such as distributed generation and distributed STATCOM, can also be utilized for this compensations. A test feeder is shown in the following, which is used to evaluate the proposed VVO framework. Every node in this feeder is an aggregate of several loads to increase the accuracy of the load forecast. Simulation results are shown in the next figures indicating the status of capacitors and tap positions for the voltage regulator. The achieved reductions in total power losses and total demand compared to the case with no control are also presented. For more details, please refer to the following publication: H. Ahmadi, J. R. Martí, H. W. Dommel, “A framework for volt-VAR optimization in distribution systems,” IEEE Transactions on Smart Grid, vol. 6, no. 3, pp. 1473–1483, 2015. |
|||
|
A 33-node test feeder equipped with switched capacitors and a voltage regulator. |
|||
|
Tap ratio scheduled for the voltage regulator. |
Scheduled status for switched capacitors. |
||
|
Reduction in network losses compared to the no-control case. |
Reduction in total demand compared to the no-control case. |
||
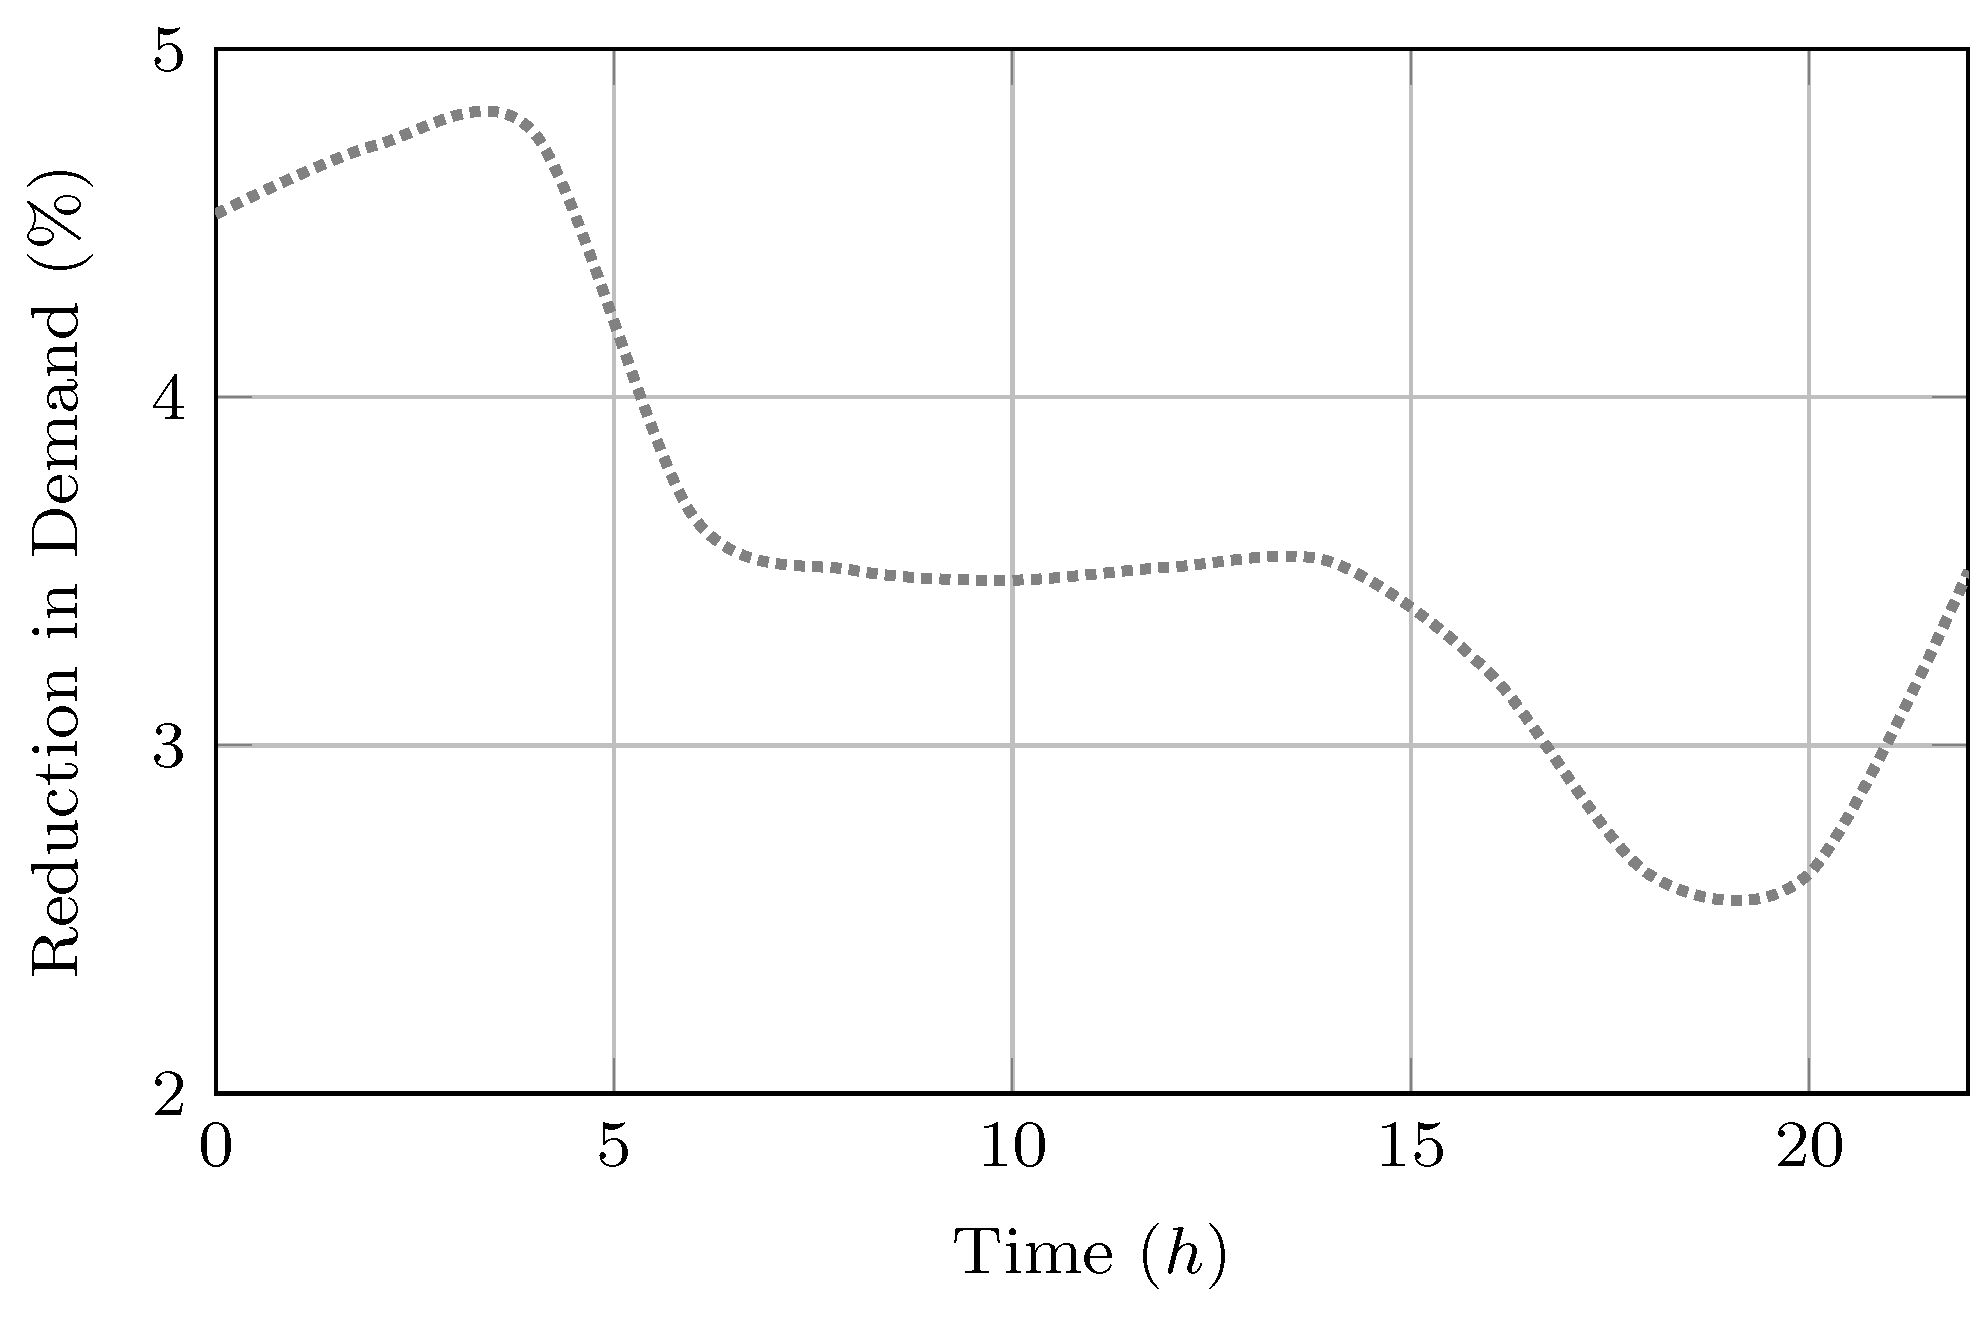
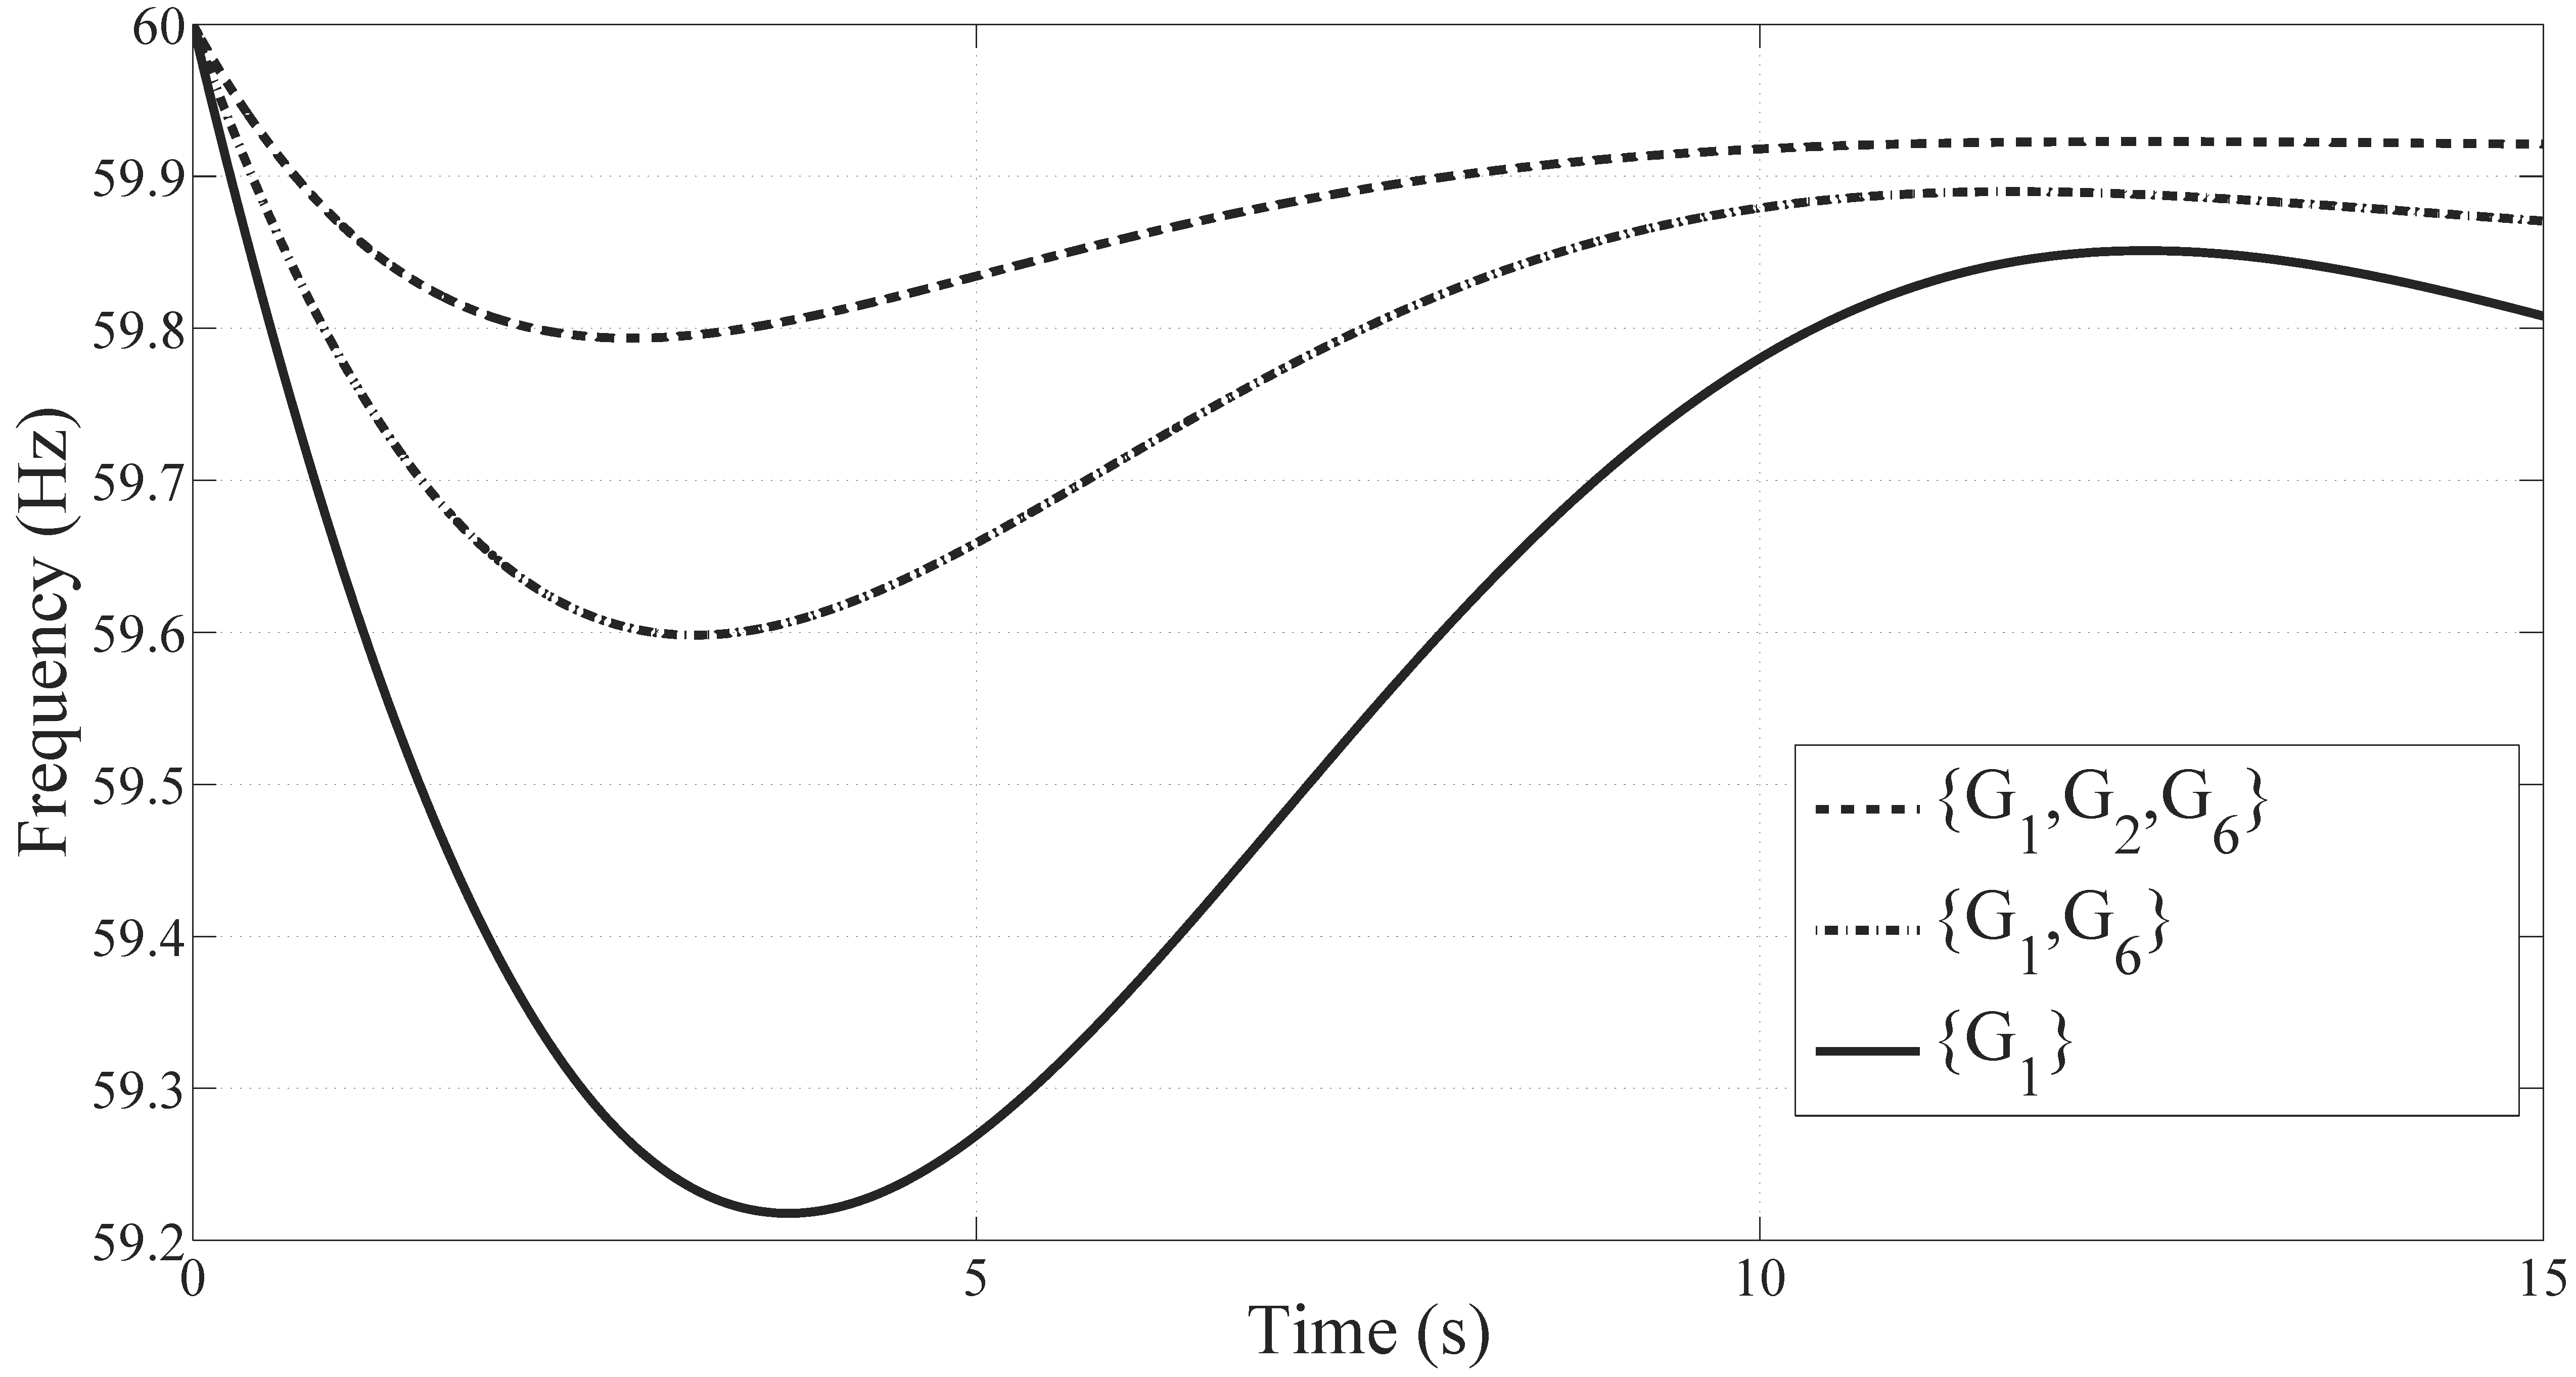
Security-Constrained Unit Commitment with System Frequency Response ConstraintsRapidly increasing penetration level of renewable energies has imposed new challenges to the operation of power systems. Inability or inadequacy of these resources in providing inertial and primary frequency responses is one of the important challenges. We addressed this issue within the framework of security-constrained unit commitment (SCUC) by adding new constraints representing the system frequency response. A modified system frequency response model is first derived and used to find analytical representation of system minimum frequency in thermal-dominant multi-machine systems. Then, an effective piecewise linearization (PWL) technique is employed to linearize the nonlinear function representing the minimum system frequency, facilitating its integration in the SCUC problem. The idea is that by keeping a few more synchronous machines online, which obviously imposes a small additional cost, the total system inertia is preserved and its capabilities for inertial response and primary frequency response are not impaired by high penetration of renewable energy resources. As is shown in the figure below, reducing the number of online units deteriorates the system inertial response. For more details about this project, please refer to the following publication: H. Ahmadi, H. Ghasemi, “Security-constrained unit commitment with linearized system frequency response constraints,” IEEE Transactions on Power Systems, vol. 29, no. 4, pp. 1536–1545, 2014.
|
|||
|
System frequency response after 10% load increase for different combinations of online generators. |
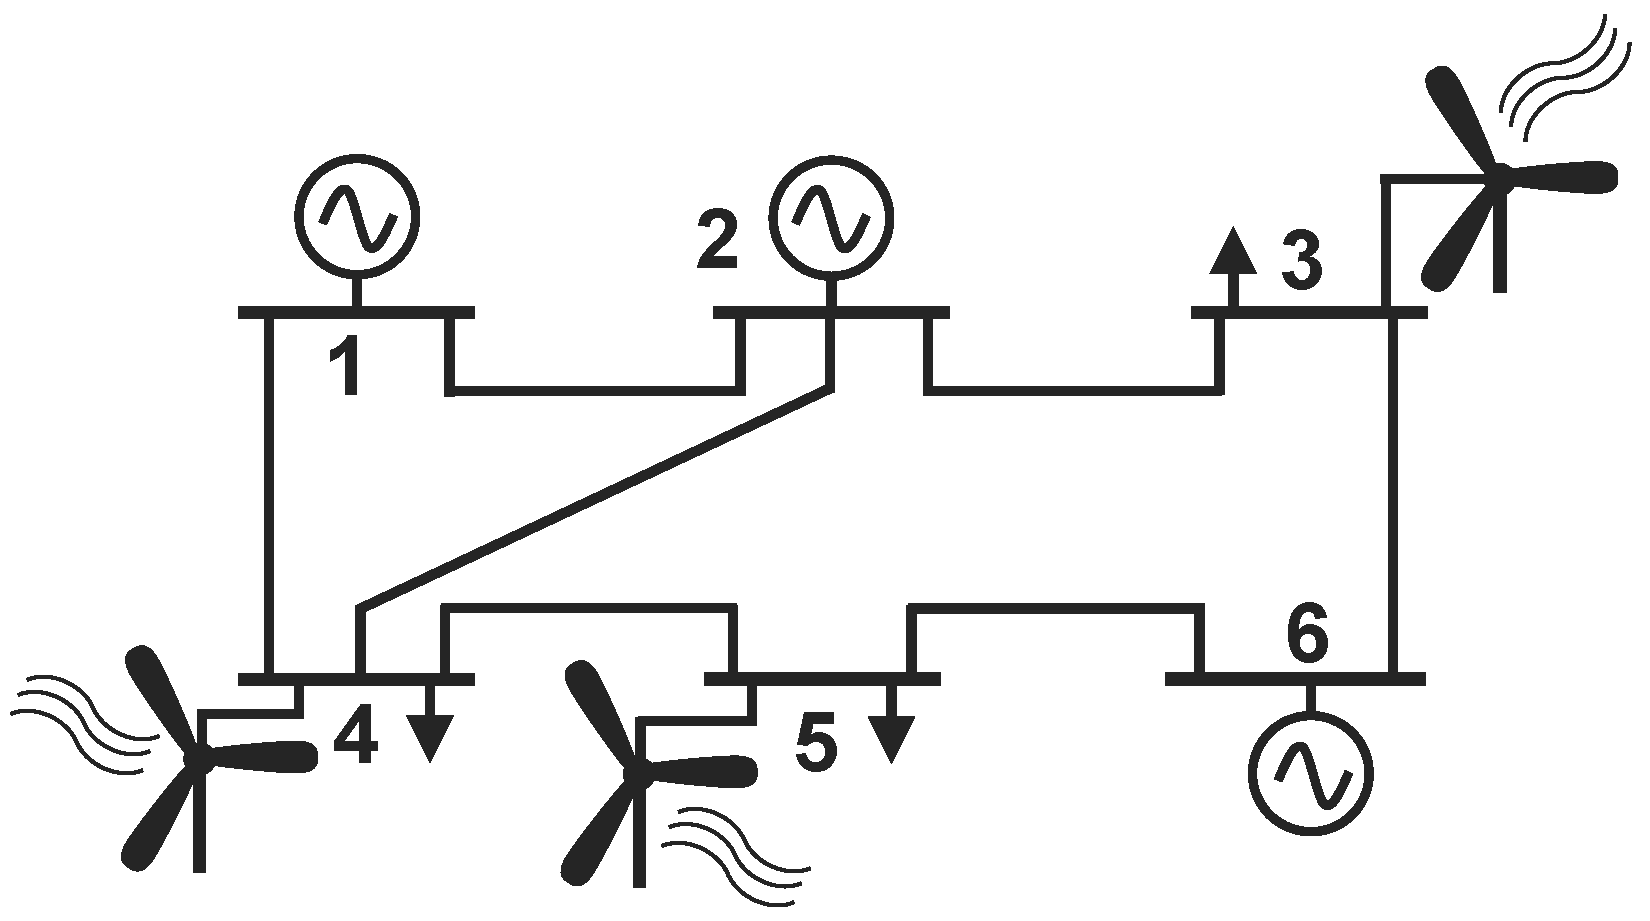
A six-bus test system with multiple wind farms. |
||
Transient Stability-Constrained Optimal Power FlowThe optimal power flow problem aims at finding a dispatch schedule
for all the generation units with the minimum cost while respecting
power system constraints, such as bus voltage limits, line flow limits,
generators limits, etc. Besides, the N-1 security assessment can also be
incorporated in the OPF problem to ensure that the outage of any
transmission line will not impose any threats. These constraints are
derived based on static analysis. However, transmission system may also
undergo dynamic situations, such as short-circuits, that may cause the
synchronous generators to oscillate. Some of these events may render the
system unstable, leading to loss-of-generation, line, or even blackouts.
Transient stability analysis tools are based on the
differential-algebraic equations (DAE) that describe the system
dynamics. There have been some proposals in the literature to
incorporate these DAEs in the OPF problem. We proposed two approaches to
include these constraints in the OPF problem considering detailed
dynamic models of generators and their controls. The first method is
based on the maximum relative rotor angle deviation (MRRAD) of
generators which suits systems that have specific requirements on MRRAD.
The second method represents the transient stability margin of the
system based on generators output power and hence does not rely on
MRRADs. The transient stability boundary can be represented as a
nonlinear Assume a system with two generators. The stable and unstable regions are shown in the following figure. The transient stability boundary (TSB) can be determined numerically and the ANN can be adopted to find its mathematical representation. This formulation is added to the OPF problem as a constraint. The second approach is based on rotor angles. The 3D figure shows the MRRAD for the two generators for a particular contingency. Beyond some certain values for the generators output power, the MRRAD is greater than the safety margins and, therefore, appropriate limits can be introduced to insure a stable operating point in the OPF. For more details on this work, please refer to the following paper: H. Ahmadi, H. Ghasemi, A. M. Haddadi, H. Lesani, “Two approaches to transient stability-constrained optimal power flow,” International Journal of Electrical Power & Energy Systems, vol. 47, pp. 181–192, 2013. |
|||
|
Transient stability boundary of a two-machine system. |
Maximum relative rotor angle deviation for G3 under a particular contingency. |
||
Electromagnetic Fields in Vicinity of High-Voltage Transmission LinesSome studies have reported health issues as a result of being imposed to the electromagnetic fields from HV transmission lines. We conducted several measurements in different areas, such as overhead HV transmission lines, GIS compartments, and some appliances and compared them with the standard limits. Electric field above 10 kV/m have been measured under 230 kV transmission lines. Results show that there is no serious concern for the people living near these transmission lines. However, for the individuals who are beneath those lines for extended periods of time, there might be some concerns. In a simulation study, three arrangements of 230kV conductors were analyzed and the best structure for reducing the electric and magnetic fields is determined to be the circular arrangement. For details on the simulation and measurements, please refer to the following paper: H. Ahmadi, S. Mohseni, A. A. Shayegani Akmal, “Electromagnetic fields near transmission lines–problems and solutions,” Journal of Environmental Health Sciences & Engineering, vol. 7, no. 2, pp. 181–188, 2010.
|
|||
Undergrad Projects in High Voltage Lab
|
|||
Undergrad Projects in Electric Drive Lab
|
|||
This site was last updated 05/13/15