Print version of this Book (PDF file)
General Statistics
The IC-CAP Statistics statistical summary window provides one of the key sets of information that assist in arriving at informed statistical inferences—numerical measures that describe the two aspects of descriptive statistics, central tendency and variability or dispersion. Measures of central tendency describe the center of the distribution of measurements and measures of variability describe how the measurements vary about the center.
Mean
A mean is a measure of central tendency. It is the sum of all the values divided by the total number of values. For example, 3 is the mean of 1, 2, 3, 4, and 5. A mean is the true arithmetic "average" of a set of values, and it is computed as follows:

Only one mean value exists for any given set of values, and is applicable only to quantitative data. The mean is subject to distortion when extreme values or outliers are present in the set. In such cases, the mean ceases to be an accurate measure of the central value.
Median
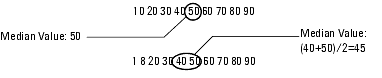
The median is another measure of central tendency. A median is the middle value when all the values in the data set are arranged from lowest to highest. For example, 3 is the median of 1, 2, 3, 4, and 5. It is the true midpoint of a set of values.
Only one median value exists for any given set of values, it is not influenced by extreme values within the set, and is applicable only to quantitative data.
In a data set with an odd number of values, the median is the middle value; in a data set with an even number of values, the median is an average of the two middle values. In either case, an equal number of values may be found above and below the median
Skewness
Skewness indicates the degree of asymmetry of a distribution. It is a measure of how much the sample varies from a normal distribution where the mean, median, mode, and trimmed mean have the same value
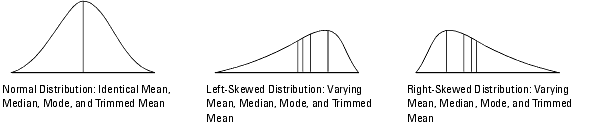
In a symmetric distribution, the value of skewness is 0. A positive skewness value indicates that relatively more values are above the mean than below it; a negative skewness value indicates that relatively more values are below the mean than above it. However skewness is highly variable and difficult to interpret for small samples.
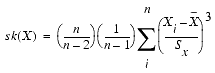
Skewness is the average cubed deviation about the mean, and it is computed as follows:
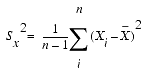
Variance
Variance indicates the dispersion or variability of the data. It is a measure of the spread of values about the mean. When the values are clustered around the mean, the variance is small. When the values are widely scattered, the variance is large.
The variance of a set of n measurements can be expressed simply as the sum of the squared deviations of the measurements from their mean divided by n-1.
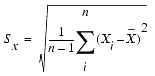
Standard Deviation
Standard deviation is another measure of the dispersion or variability of the data. It is a measure of the "average" deviation about the mean. When the values are clustered around the mean, the standard deviation is small. When the values are widely scattered, the standard deviation is large.
The standard deviation of a set of measurements can be expressed as the positive square root of the variance.
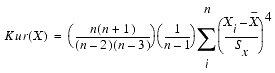
Kurtosis
Kurtosis indicates the heaviness of the tails in relation to the middle of the distribution. It is a measure of the peakedness of the distribution.
For example, when a large number of the values are clustered around the middle, the curve is peaked, resulting in a greater kurtosis value. When the values are spread around more evenly the curve is flattened, resulting in smaller kurtosis values.
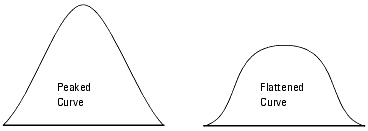
In a normal distribution, the value of kurtosis is 3. A greater kurtosis value indicates that relatively less values are distributed around the tails; a smaller kurtosis value indicates that relatively more values are distributed around the tails. However kurtosis is highly variable and difficult to interpret for small samples.
Kurtosis is the average of the fourth power of the deviations about the mean, and is always a positive value that can be expressed as:
Minimum
A minimum is the lowest value in the data set. The difference between the minimum and the maximum value provides the simplest measure of data variation, the range.
Maximum
A maximum is the greatest value in the data set. The difference between the maximum and the minimum value provides the simplest measure of data variation, the range.
Median Absolute Deviation
The median absolute deviation (MAD) provides a scale estimate. The scale value is used in the Data > Data Filter operation. Scale is defined as the median absolute deviation (MAD) divided by a constant (approximately 0.6745). This standardizes MAD in order to make the scale estimate consistent with the standard deviation of a normal distribution.
MAD = median {|x1 - median {xj }|}
The scale constant (approximately 0.6745) is the inverse of the standard normal distribution function evaluated at 3/4.
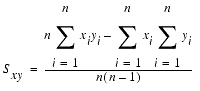
Covariance
Covariance is the expected value of the product of the deviations of two random variable from their respective means. The covariance of two variables, x and y, can be expressed as:
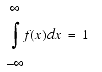
Probability Density Function (PDF)
PDF is function of a continuous random variable whose integral over an interval gives the probability that its value will fall within the interval.
The significance of the PDF f(x) is that f(x) dx is the probability that the random variable is in the interval (x,x+dx), written as:
Specifically, the probability that the random variable is in the interval (a, b) is:
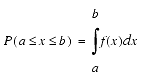
 ,
,