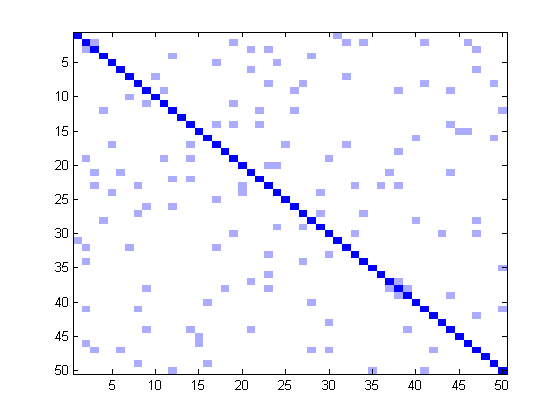
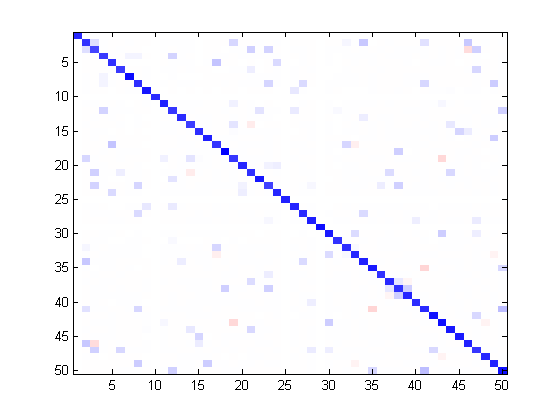
We simulate an example with 50 variables and 200 observations. Left: true precision matrix pattern. Right: estimated precision matrix pattern by graphical Lasso.
Download .m files:
graphicalLasso.m
Graphical Lasso
Matlab implementation of the graphical Lasso model for estimating sparse inverse covariance matrix (a.k.a. precision or concentration matrix)
minimize tr( Theta * S ) - logdet( Theta ) + ρ * || Theta ||1
over all positive-definite and symmetric matrices Theta. S is an estimate of the covariance matrix (usually sample covariance matrix) and ρ is a regularization parameter.
I/O:
Input: sample covariance matrix S, penalty parameter
ρ.
Output: the estimated precision matrix and the regularized covariance
matrix.
Example:
We simulate an example with 50 variables and 200 observations. Left:
true precision matrix pattern. Right: estimated precision matrix pattern
by graphical Lasso.
Download .m files:
graphicalLasso.m
References:
[1] Fu (1998) Penalized regression: the bridge versus the lasso. J. Comput.
Graph. Stats.
[2] Friedman, et al. (2007) Sparse inverse covariance estimation with the
graphical Lasso. Biostatistics.