
| Matlab & Simulink Tools | ||
| Links | ||
| MathWorks | Link to the Matlab website which contains a multitude of resources contributed by other users. | |
| Control | Page of tutorials on using Matlab & Simulink for various control problems. | |
| Documentation | ||
| Notes | Brief description of how to use Matlab (pdf file) | |
| Users Guide | Manual for the USB1408FS DAQ module. | |
| Examples & Tools | ||
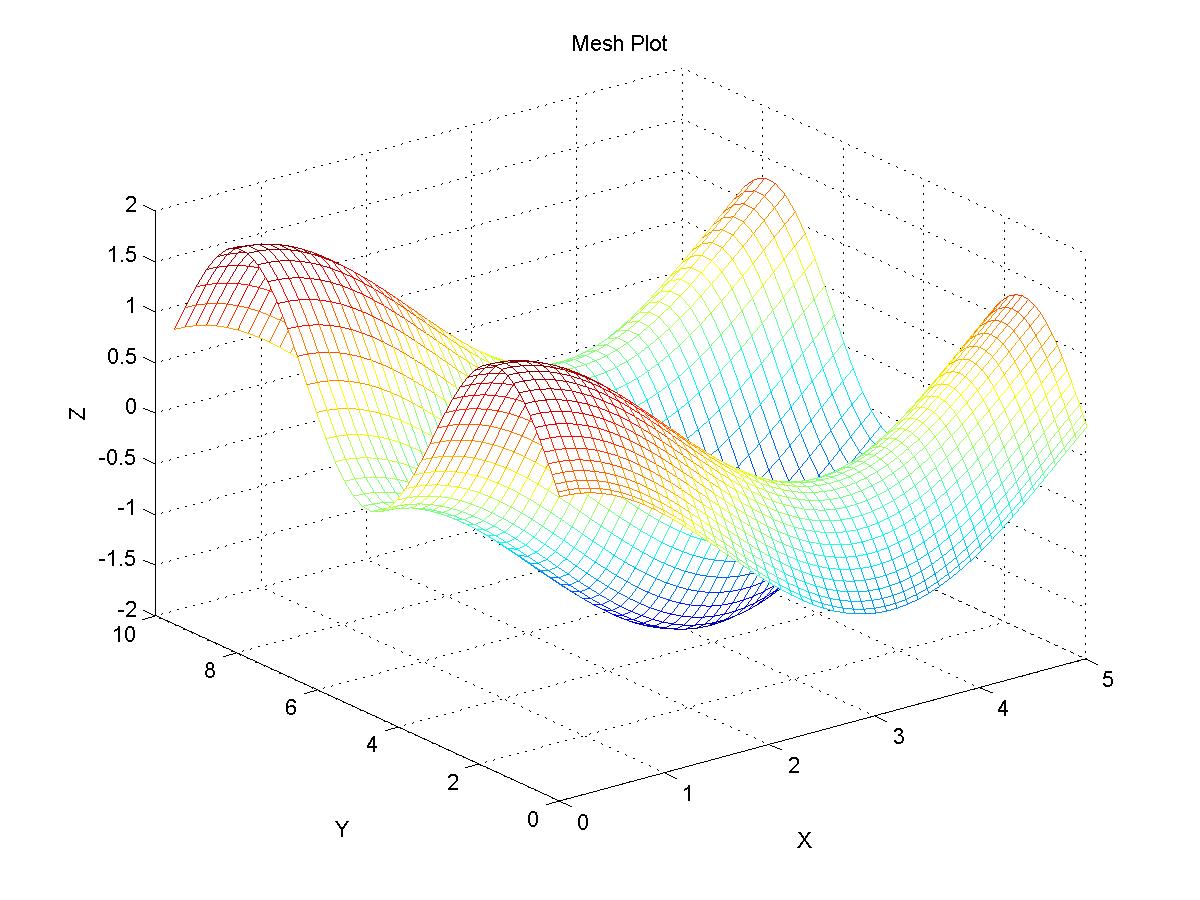
| Matlab | Example Mfile for plotting, JPEG1, JPEG2 | |
| Mfile (asymp.m) for approximate Bode plots (phase portion not so good) | ||
| Mfile (nyqlog.m) for logarithmic Nyquist plots. | ||
| Sample Matlab source code to read 800 samples at 8KHz from one of the analog input channels of the DAQ. | ||
| Simulink | Model file with many of my own favourite (commonly used) Simulink blocks. | |
| Instructions and model files for setting up a virtual reality simulation of a traffic light. | ||
Simulink Real-Time Block. If you have a 64-bit machine, make sure you have the current version (V4) since it includes a 64-bit executeable file (mexw64). To install this feature into your Simulink library, copy the files in the zip file into a directory somewhere on your computer. When you installed Matlab, a "MATLAB" directory was created in your "Documents" folder. If you put them here then you are done because this directory is already in your Matlab searchpath. If you put them somewhere else you need to add that directory to your Matlab searchpath. To to this, create the following file (or edit it if it already exists): Start up MATLAB and open your SIMULINK browser. A 'Simulink Execution Control' page should exist with the SEC block in it (looks like a stopwatch). Drag this block onto your model to have it run in real time. You do not need to connect the block to anything but connecting it to a 'Terminator' sink block will get rid of a warning message. |
||
| Frequently Asked Questions: Simulink | ||
| Question | I want to use a scope plot in a report but I don't want a black background. | |
| Answer | Click the "Scope Parameters" button on the title bar of the scope window. Now you have a regular Matlab figure with the same information on it as the Simulink plot. You can use "print -djpeg" or any other Matlab commands for saving, printing or manipulating a figure window. |
|
| Question | I would like to write a custom Simulink block that uses a bunch of Matlab commands to manipulate a signal. What is the easiest way to do this? | |
| Answer | Insert an "Embedded MATLAB Function" block (User-Defined Functions menu) into your system and double-click it. This will open an editor that allows you to enter any MATLAB code you like. Here's an example. | |
| Question | What is the difference between a PID Controller and a PID Controller with Approximate Derivative? | |
| Answer | By definition, a digital signal has a derivative that is either 0 or infinity. Once an analog signal is sampled, the derivative is lost and must be approximated. These two blocks use different methods for approximating the derivative. Right-click and select "Look Under Mask" to see exactly how each block approximates the derivative term. | |